STEP-BY-STEP TECHNOLOGY GUIDE: Two-Sample t Test and Confidence Interval for μ1 − μ2
TI-83/84
Welch's t Test and Confidence Interval for μ1 − μ2 Data Option
- Step 1 Enter one sample into List L1 and the other sample into List L2.
- Step 2 Press STAT and highlight TESTS.
- Step 3 Press 4 (for the 2-Samp TTest). The 2-Samp TTest menu appears.
- Step 4 For input (INPT), move the cursor over Data and press ENTER.
- Step 5 For List1 and List2, enter L1 and L2.
Step 6 For Freq1 and Freq2, enter 1.
600
- Step 7 For μ1, choose the form of Ha.
- Step 8 For Pooled, select No because we are not assuming the variances are equal, and do not need an estimate of the common variance (Figure 13).
- Step 9 Highlight Calculate and press ENTER.
Stats Option. (Example 8 is used to illustrate this method.) Here you enter the summary statistics.
- Step 1 Press STAT and highlight TESTS.
- Step 2 Press 4 (for the 2-Samp TTest). The 2-Samp TTest menu appears.
- Step 3 For input (Inpt), move the cursor over Stats and press ENTER.
- Step 4 For x̄1, enter 708. For Sx1, enter 34. For n1, enter 10 0. For x̄2, enter 635. For Sx2, enter 70. For n2, enter 100 (Figure 14).
- Step 5 For μ1, choose the form of Ha. For Example 8, choose “> μ2” and press ENTER.
- Step 6 For Pooled, press No (Figure 15).
- Step 7 Highlight Calculate and press ENTER.
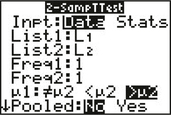 Figure 10.13: FIGURE 13
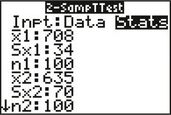 Figure 10.14: FIGURE 14
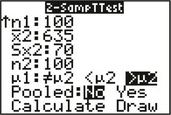 Figure 10.15: FIGURE 15
Welch's Two-Sample t interval for μ1 − μ2
Follow the same steps as for the t test, except select 0: 2-SampTInt. Also, to select confidence level (C-Level), enter 0.95 for 95%.
Pooled Variance t Test and Confidence Interval for μ1 − μ2
Follow the same steps as for Welch's method, except select Yes for Pooled in Step 8.
Z Test for μ1 − μ2
Data Option
- Step 1 Enter the data into Lists L1 and L2.
- Step 2 Press STAT and highlight TESTS.
- Step 3 Press 3 (for the 2-Samp Z Test). The 2-Samp Z Test menu appears.
- Step 4 For input (INPT), move the cursor over Data and press ENTER.
- Step 5 Enter the values for σ1 and σ2.
- Step 6 For List1 and List2, enter L1 and L2.
- Step 7 For Freq1 and Freq2, enter 1.
- Step 8 For μ1, choose the form of Ha and press ENTER.
- Step 9 Highlight Calculate and press ENTER.
Stats Option
- Step 1 Press STAT and highlight TESTS.
- Step 2 Press 3 (for the 2-Samp Z Test). The 2-Samp Z Test menu appears.
- Step 3 For input (Inpt), move the cursor over Stats and press ENTER.
- Step 4 Enter the values for σ1, σ2, s̄x1, n1, s̄x2, and n2.
- Step 5 For μ1, choose the form of Ha and press ENTER.
- Step 6 Highlight Calculate and press ENTER.
Z Confidence Interval for μ1 − μ2
Follow the same steps as for the Z test, except select 9: 2-SampleZInt at Step 2.
EXCEL
Welch's t Test for μ1 − μ2
- Step 1 Enter Sample 1 and Sample 2 data into columns A and B, respectively.
- Step 2 Select Data > Data Analysis > t-Test: Two-Sample Assuming unequal Variances, and click OK.
- Step 3 For the Input, select the cells in column A for the Variable 1 Range and the cells in column B for the Variable 2 Range.
- Step 4 For the hypothesized mean difference, enter 0, enter your value for Alpha, and click OK.
Pooled Variance t Test for μ1 − μ2
Follow the same steps as for Welch's method, except select t-test: Two-Sample
Assuming Equal Variances in Step 2.
Z Test for μ1 − μ2
- Step 1 Enter Sample 1 and Sample 2 data into columns A and B, respectively.
- Step 2 Select Data > Data Analysis > Z-Test: Two-Sample for Means, and click OK.
- Step 3 For the Input, select the cells in column A for the Variable 1 Range and the cells in column B for the Variable 2 Range. For the hypothesized mean difference, enter 0.
- Step 4 For Variable 1 Variance (known) and Variable 2 Variance (known), enter the values for σ21 and σ22. Enter the value α for ALPHA and click OK.
MINITAB
Welch's t Test and Confidence Interval for μ1 − μ2
- Step 1 Enter Sample 1 and Sample 2 data into columns C1 and C2, respectively.
- Step 2 Click Stat > Basic Statistics > 2-Sample t….
- Step 3
If you have the data values, select Each sample is in its own column, and select C1 and C2 for Sample 1 and Sample 2, respectively.
601
- If you have the summary statistics, select Summarized data and enter the sample size, mean, and standard deviation for each of Sample 1 and Sample 2.
- Step 4 Click Options, enter your Confidence level, the Hypothesized difference, and select the form of the Alternative hypothesis.
- Step 5 Click OK and click OK again.
Pooled Variance t Test and Confidence Interval for μ1 − μ2
Follow the same steps as for Welch's method, except select Assume equal variances at the end of Step 4.
SPSS
Welch's t Test and t Interval for μ1 − μ2
- Step 1 Enter numeric group labels into the first column, and the corresponding data values into the second column.
- Step 2 Select Analyze > Compare Means > Independent-Samples T Test….
- Step 3 Put the variable with data values in the Test Variable(s) box, and the variable with group labels in the Grouping Variable box. Click Define Groups… and enter the values you used to define your groups. Click Continue.
- Step 4 Click Options… and enter the Confidence Interval Percentage. Click Continue, and then click OK. The results are found in the Independent Samples Test box, in the Equal variances not assumed row.
Pooled Variance t Test and t Interval for μ1 − μ2
- Step 1 Use the same steps as for Welch's t test and t interval. The results are found in the Equal variances assumed row of the Independent Samples Test box.
JMP
Welch's t Test and t Interval for μ1 − μ2
- Step 1 Enter numeric group labels into Column 1, and the corresponding data values into Column 2. Right-click Column 1, click Column Info…, and change Data Type to Character. Click OK.
- Step 2 Select Analyze > Fit Y by X. Put Column 1 in the in the X, Factor box, and Column 2 in the Y, Response box. Click OK.
- Step 3 Click the red triangle beside Oneway Analysis of Column 2 by Column 1. Select t Test. To change the confidence level, select the red triangle, click Set α level, and select your desired α.
Pooled Variance t Test and t Interval for μ1 − μ2
Use the same steps as for Welch's t test and t interval, except choose Means/Anova/Pooled t during Step 3 and look at the t Test output.
CRUNCHIT!
Welch's t Test and t Interval for μ1 − μ2
- Step 1 Click Statistics, highlight t, and select 2-sample. Select the Summarized tab.
- Step 2 Enter n, the Sample Mean, and the Standard Deviation for Sample 1 and Sample 2.
- Step 3
- For the hypothesis test, select the Hypothesis Test tab, enter the Difference of means under null hypothesis, choose the correct form of the Alternative hypothesis, and click Calculate.
- For the confidence interval, select the Confidence Interval tab, enter the Confidence Interval Level (%), and click Calculate.
Pooled Variance t Test and t Interval for μ1 − μ2
Use the same steps as for Welch's t test and t interval, except make sure to check the Pooled Variance option in Step 2.
Z test for μ1 − μ2
- Step 1 Click Statistics, highlight z, and select 2-sample. Select the Summarized tab. Enter n and the Sample Mean for both Sample 1 and Sample 2.
- Step 2 Enter the population standard deviations for each sample under StdDev of Group 1 and StdDev of Group 2. Enter the Difference of means under null hypothesis, choose the correct form of the Alternative hypothesis, and click Calculate.