STEP-BY-STEP TECHNOLOGY GUIDE: Test for independence or Test for the Homogeneity of Proportions
656
We demonstrate using Example 8 (page 650).
TI-83/84
Entering Matrix Data
- Step 1 Press 2nd, then MATRIX.
- Step 2 Highlight EDIT, and press ENTER.
- Step 3 Set the dimensions of MATRIX[A] (number of rows × number of columns). Table 9 has 2 rows and 3 columns, so enter 2, press ENTER, enter 3, and press ENTER.
- Step 4 Enter the first number in the first cell, 51, and press ENTER.
- Step 5 Continue entering the data row by row until the matrix is complete (Figure 25).
χ2 Test for Independence or Test for Homogeneity of Proportions
- Step 1 Enter the data into Matrix[A].
- Step 2 Press STAT, highlight TESTS, select χ2 Test, and press ENTER.
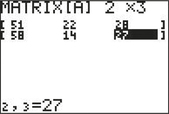 Figure 11.26: FIGURE 25
 - Step 3 Make sure that the Observed frequencies are put into Matrix [A]. The expected frequencies are automatically generated and put into Matrix[B]. Highlight Calculate, and press ENTER. The results are shown in Figure 17 in Example 8.
- Step 4 To view the expected frequencies, press 2nd MATRIX, highlight EDIT, and choose 2 for Matrix[B].
EXCEL
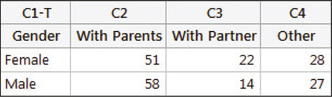
- Step 1 Enter the data from Table 9, including row and column totals, in cells A1 to D3.
- Step 2 Use the JMP plug-in for Excel.
MINITAB
- Step 1 Enter the observed frequencies from Table 9 into the Minitab worksheet, as shown here.
- Step 2 Click Stat > Tables > Chi-Square Test for Association….
- Step 3 Select Summarized data in a two-way table, then choose each of columns C2, C3, and C4 as the Columns containing the table.
- Step 4 For Labels for the table (optional), select Gender for the Rows input. Then click OK. The results are shown in Figure 18 in Example 8.
SPSS
Step 1 Enter the data as shown in Figure 26.
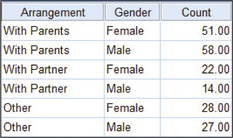 Figure 11.27: FIGURE 26 SPSS data input.
- Step 2 Click Data > Weight Cases…, select Weight cases by, and move the variable Count to Frequency Variable. Click OK.
- Step 3 Click Analyze > Descriptive Statistics > Crosstabs…. Move the variable Gender to Row(s), and move Arrangement to Column(s).
- Step 4 Click Statistics…, and select Chi-square. Click Continue, then OK. The output is shown in Figure 27.
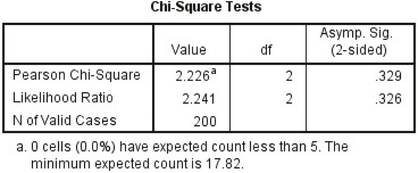 Figure 11.28: FIGURE 27 SPSS output.
JMP
- Step 1 Click File > New > Data Table. Input the data in a similar way to Figure 26.
- Step 2 Click Analyze > Fit Y by X. Move Arrangement to Y, Response, Gender to X, Factor, and Count to Freq. Click OK.
- Step 3 The output is under the Tests heading, in the Pearson row. See Figure 19 in Example 8.
657
CRUNCHIT!
- Step 1 Click File, highlight Load from Larose, Discostat3e > Chapter 11, and click on Example 11_08.
- Step 2 Click Statistics and select Contingency table > with counts. For Row Variable select Gender. For Column Variable select Arrangement. For Counts select Count. Then click Calculate.