STEP-BY-STEP TECHNOLOGY GUIDE: Randomized Block Design
Neither the TI-83/84 nor Excel performs randomized block design analysis.
MINITAB
We shall use the data from Examples 10 and 11.
- Step 1 Enter the score (response) data into column C1, the method (treatment) in column C2, and the course (block) in column C3 (see Figure 35).
- Step 2 Select Stat > ANOVA > General Linear Model > Balanced ANOVA.
- Step 3 For Responses, select the score (response) variable; for Factors, enter the course and method variables. Click OK.
Results are shown in Figure 32 of Example 11.
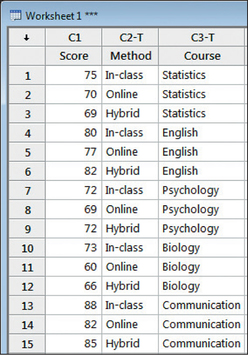
Figure 12.35: FIGURE 35 Entering the RBD data into Minitab.
699
SPSS
- Step 1 Enter the score (response) data into column C1, a numeric code for the method (treatment) in column C2, and a numeric code for the course (block) in column C3.
- Step 2 Under Variable View, rename the characters Score, Method, and Course. Change the Decimals of Method and Course to 0 and the Width of Method and Course to 1.
- Step 3 Select Analyze > General Linear Model > Univariate….
- Step 4 For Dependent Variable, select Score. For Fixed Factor(s), enter Method and Course.
- Step 5 Click Model…, select Custom, choose Main effects from the Build Term(s) Type: drop-down menu, and move the Course and Method variables into the Model box. Deselect Include intercept in model. Click Continue, then OK. Results are shown in Figure 33 of Example 11.
JMP
- Step 1 Enter the score (response) data into column C1, the method (treatment) in column C2, and the course (block) in column C3 (see Figure 35).
- Step 2 Select Analyze > Fit Y by X. Put Score in the Y, Response box, Method in the X, Factor box, and Course in the Block box. Click OK.
- Step 3 Click the red triangle beside “Oneway Analysis,” and select Means/Anova . The result is in the Analysis of Variance table, Figure 36.
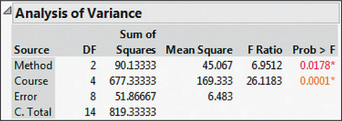 Figure 12.36: FIGURE 36 JMP output for randomized block design.