STEP-BY-STEP TECHNOLOGY GUIDE: two-way ANOVA
707
We illustrate using the data from Example 14.
The TI-83/84 does not perform randomized block design analysis.
EXCEL
- Step 1 Input the data as shown in Figure 43.
- Step 2 Click Data > Data Analysis, and select Anova: Two-Factor With Replication. Click OK.
- Step 3 For Input Range, highlight cells A2 through D6. For Rows per sample, enter 2. Click OK. The results are shown in Figure 44.
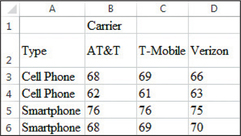 Figure 12.43: FIGURE 43 Excel data input.
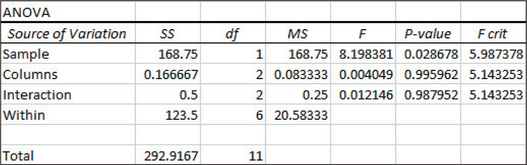 Figure 12.44: FIGURE 44 Excel output.
MINITAB
Performing Two-Way ANOVA
- Step 1 Enter the carrier (Factor A) data in column C1, the type (Factor B) data in column C2, and the rating data (response) in column C3, as shown in Figure 45.
- Step 2 Select Stat, highlight ANOVA, and choose Balanced ANOVA….
- Step 3 For Responses, select the Rating data; for Model, enter Type Carrier Type*Carrier. Click OK.
Constructing an Interaction Plot
- Step 1 Enter the data just like in Step 1 above. Select Stat, highlight ANOVA, and choose Interaction plot….
- Step 2 For Responses, select Rating. For Factors, select Type and Carrier. Click OK. Results are shown in Figure 39 of Example 14.
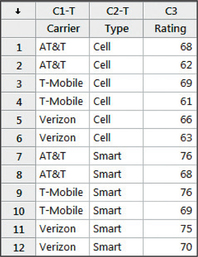 Figure 12.45: FIGURE 45 Entering the two-way ANOVA data into Minitab.
SPSS
Performing Two-Way ANOVA and Constructing an Interaction Plot
- Step 1 Enter a numeric code for carrier (Factor A), a numeric code for type (Factor B), and the rating data (response) in the first three columns. Under the Variable View tab, rename the three variables Carrier, Type, and Rating, set the Decimals of Type and Carrier to 0, and set the Width of Type and Carrier to 1.
- Step 2 Select Analyze > General Linear Model > Univariate. Move Rating to Dependent Variable, and Carrier and Type to Fixed Factor(s).
- Step 3 Click Plots…. Move Carrier to Horizontal Axis and Type to Separate Lines. Click Add, then click Continue. Click OK.
JMP
Performing Two-Way ANOVA and Constructing an Interaction Plot
- Step 1 Click File > New > Data Table. Enter the carrier (Factor A) data in Column 1, the type (Factor B) data in Column 2, and the rating data (response) in Column 3, similar to Figure 45. Rename the columns Carrier, Type, and Rating.
- Step 2 Click Analyze > Fit Model.
- Step 3 Move Rating to Y. Select Carrier and click Add under Construct Model Effects. Select Type and click Add again. Then click Carrier, hold the Shift button on your keyboard, and click Type to select both. Click Cross under Construct Model Effects. Click Run. Part of the results are shown in Figure 46.
- Step 4 Click the red triangle beside “Response Rating,” click Factor Profiling, and select Interaction Plots.
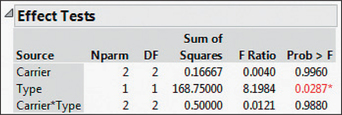 Figure 12.46: FIGURE 46 JMP two-way ANOVA results.
708
CRUNCHIT!
Two-Way ANOVA
We will use the data from Example 13.
- Step 1 Click File, highlight Load from Larose, Discostat3e > Chapter 12, and click on Example 04_13.
- Step 2 Click Statistics and highlight ANOVA, then select Two-way.
- Step 3 For Factor 1 select Carrier. For Factor 2 select Type. For Value s select Rating. Then click Calculate.