Section 12.4 Exercises
CLARIFYING THE CONCEPTS
Question 12.117
1. State two differences between the randomized block design and two-way ANOVA. (p. 702)
12.4.1
We are interested in testing for the significance of both factors and we need to test for interaction of the two factors.
Question 12.118
2. Together, Factor A and Factor B are known as what? (p. 702)
Question 12.119
3. Before we perform two-way ANOVA, what should we check for the presence of? (p. 702)
12.4.3
Factor interaction
Question 12.120
4. Provide an example of interaction between two factors. (p. 703)
Question 12.121
5. What is an interaction plot? What is it used for? (p. 703)
12.4.5
It is a graphical representation of the cell means for each cell in the contingency table. It is used to investigate the presence of interaction between the two factors.
Question 12.122
6. What do the following indicate in an interaction plot (p. 703):
- Lines that are not at all parallel
- Parallel lines
- Nearly parallel lines
Question 12.123
7. What are the three hypothesis tests involved in a two-way ANOVA? (p. 704)
12.4.7
Test for interaction between the factors, test for Factor A effect, Test for Factor B effect
Question 12.124
8. What should we do if the test for interaction between the factors reveals evidence for the presence of interaction? Why do we do this? (p. 704)
PRACTICING THE TECHNIQUES
 CHECK IT OUT!
| To do | Check out | Topic |
|---|---|---|
| Exercises 9–16 | Example 13 | Constructing an interaction plot |
| Exercises 17–20 | Example 14 | Performing a two-way ANOVA |
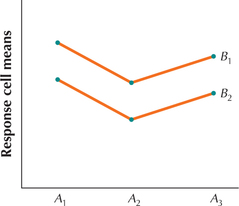
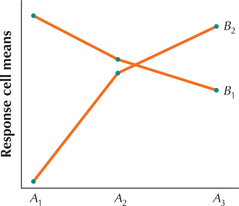
For Exercises 9–12, use the interaction plot to determine whether there is no interaction, some interaction, or substantial interaction between Factor A and Factor B.
Question 12.125
9.
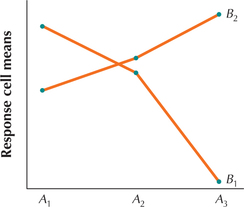
12.4.9
Significant interaction
Question 12.126
10.
Question 12.127
11.
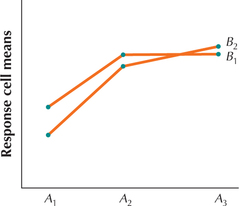
12.4.11
Some interaction
709
Question 12.128
12.
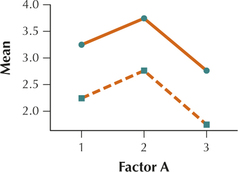
For the data in Exercises 13–16, draw an interaction plot and determine whether there exists no interaction, some interaction, or substantial interaction.
Question 12.129
13.
| Factor B | Factor A | ||||||
|---|---|---|---|---|---|---|---|
| 3.0 | 3.5 | 4.0 | 3.5 | 2.5 | 3.0 | ||
| 2.5 | 2.0 | 2.5 | 3.0 | 2.0 | 1.5 | ||
12.4.13
The lines are parallel, so there is no interaction between Factor A and Factor B.
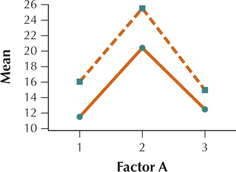
Question 12.130
14.
| Factor B | Factor A | ||||||
|---|---|---|---|---|---|---|---|
| 11 | 12 | 26 | 25 | 13 | 12 | ||
| 15 | 17 | 20 | 21 | 16 | 14 | ||
Question 12.131
15.
| Factor B | Factor A | ||||||
|---|---|---|---|---|---|---|---|
| 11 | 12 | 20 | 21 | 13 | 12 | ||
| 15 | 17 | 26 | 25 | 16 | 14 | ||
12.4.15
The lines are nearly parallel, so there is no interaction between Factors A and B.
Question 12.132
16.
| Factor B | Factor A | ||||||
|---|---|---|---|---|---|---|---|
| 100 | 105 | 95 | 100 | 110 | 100 | ||
| 80 | 85 | 85 | 90 | 80 | 90 | ||
For Exercises 17–20, use level of significance to do the following for the indicated data:
- Test for interaction. Confirm that the result agrees with the interaction plot you constructed.
- If appropriate, test for the Factor A effect.
- If appropriate, test for the Factor B effect.
Question 12.133
17. Data in Exercise 13
12.4.17
(a) : There is no interaction between carrier (Factor A) and type (Factor B). : There is interaction between carrier (Factor A) and type (Factor B). Reject if the . The p-value = 1.00, which is not ; therefore we do not reject . There is insufficient evidence of interaction between carrier (Factor A) and type (Factor B) at level of significance . This result agrees with the interaction plot in Exercise 13.
(b) : There is no carrier (Factor A) effect. That is, the population means do not differ by carrier. : There is a carrier (Factor A) effect. That is, the population means do differ by carrier. Reject if the . The , which is ; therefore we reject . There is evidence for a carrier (Factor A) effect. In other words, there is evidence at level of significance that the population means do differ by carrier. (c) : There is no type (Factor B) effect. That is, the population means do not differ by type. : There is a type (Factor B) effect. That is, the population means do differ by type. Reject if the . The , which is ; therefore we reject . There is evidence for a type (Factor B) effect. In other words, there is evidence at level of significance that the population means do differ by type.
Question 12.134
18. Data in Exercise 14
Question 12.135
19. Data in Exercise 15
12.4.19
(a) : There is no interaction between carrier (Factor A) and type (Factor B). : There is interaction between carrier (Factor A) and type (Factor B). Reject if the . The , which is not ; therefore we do not reject . There is insufficient evidence of interaction between carrier (Factor A) and type (Factor B) at level of significance . This result agrees with the interaction plot in Exercise 15.(b) : There is no carrier (Factor A) effect. That is, the population means do not differ by carrier. : There is a carrier (Factor A) effect. That is, the population means do differ by carrier. Reject if the . The , which is ; therefore we reject . There is evidence for a carrier (Factor A) effect. In other words, there is evidence at level of significance that the population means do differ by carrier. (c) : There is no type (Factor B) effect. That is, the population means do not differ by type. : There is a type (Factor B) effect. That is, the population means do differ by type. Reject if the . The , which is ; therefore we reject . There is evidence for a type (Factor B) effect. In other words, there is evidence at level of significance that the population means do differ by type.
Question 12.136
20. Data in Exercise 16
APPLYING THE CONCEPTS
Question 12.137
cardiac
21. Researchers at Harvard measured the cardiac output in liters per minute of patients involved in a cardiogenomics study. A random sample of eight patients is summarized here. Use level of significance to do the following.
- Test for interaction.
- If appropriate, test whether cardiac output differs between those who have hypertension (high blood pressure) and those who do not.
- If appropriate, test whether cardiac output differs between the genders.
| Factor B: Gender | Factor A: Hypertension | |||||
|---|---|---|---|---|---|---|
| yes | No | |||||
| Female | 1.90 | 1.68 | 2.70 | 4.20 | ||
| Male | 2.60 | 2.20 | 4.30 | 5.50 | ||
12.4.21
(a) : There is no interaction between hypertension (Factor A) and gender (Factor B). : There is interaction between hypertension (Factor A) and gender (Factor B). Reject if the . The , which is not ; therefore we do not reject . There is insufficient evidence of interaction between hypertension (Factor A) and gender (Factor B) at level of significance . (b) : There is no hypertension (Factor A) effect. That is, the population means do not differ by whether or not the person has hypertension. : There is a hypertension (Factor A) effect. That is, the population means do differ by whether or not the person has hypertension. Reject if the . The , which is ; therefore we reject . There is evidence for a hypertension (Factor A) effect. Thus we can conclude at level of significance that there is a significant difference in mean cardiac output between patients who have hypertension and patients who don't. (c) : There is no gender (Factor B) effect. That is, the population means do not differ by gender. : There is a gender (Factor B) effect. That is, the population means do differ by gender. Reject if the . The , which is not ; therefore we do not reject . There is insufficient evidence for a gender (Factor B) effect. Thus we can conclude at level of significance that there is no significant difference in mean cardiac output between females and males.
Question 12.138
assessment
22. Statistics and algebra instructors tested different types of problems for course assessment (multiple choice, short answer, and word problems) with the data provided here. Use level of significance to do the following:
- Test for interaction.
- If appropriate, test for the problem-type effect.
- If appropriate, test for the course effect.
| Factor B: Course |
Factor A: Problem type | ||||||
|---|---|---|---|---|---|---|---|
| Multiple choice |
Short answer |
Word problems |
|||||
| Statistics | 70 | 75 | 73 | 77 | 75 | 79 | |
| Algebra | 68 | 76 | 75 | 74 | 80 | 77 | |
Question 12.139
fibercereal
23. The following table contains a random sample of breakfast cereals, along with their brands, whether or not they are high in fiber (at least 3 grams), and their nutritional rating. Use level of significance to perform the two-way ANOVA.
| Cereal | Brand | Fiber | Rating |
|---|---|---|---|
| Shredded Wheat | Kellogg's | High | 68.2 |
| All Bran | Kellogg's | High | 59.4 |
| Wheaties | General Mills | High | 51.6 |
| Total | General Mills | High | 46.7 |
| Nut'n Honey | Kellogg's | Low | 29.9 |
| Corn Flakes | Kellogg's | Low | 45.9 |
| Lucky Charms | General Mills | Low | 26.7 |
| Cocoa Puffs | General Mills | Low | 22.7 |
12.4.23
: There is no interaction between brand (Factor A) and fiber (Factor B). : There is interaction between brand (Factor A) and fiber (Factor B). Reject if the . The , which is not ; therefore we do not reject . There is insufficient evidence of interaction between brand (Factor A) and fiber (Factor B) at level of significance . : There is no brand (Factor A) effect. That is, the population means do not differ by brand. : There is a brand (Factor A) effect. That is, the population means do differ by brand. Reject if the . The , which is ; therefore we reject . There is evidence for a brand (Factor A) effect. Thus we can conclude at level of significance that there is a significant difference in mean nutritional ratings between Kellogg's cereals and General Mills cereals. : There is no fiber (Factor B) effect. That is, the population means do not differ by whether or not the cereal has fiber. : There is a fiber (Factor B) effect. That is, the population means do differ by whether or not the cereal has fiber. Reject if the . The , which is ; therefore we reject . There is evidence for a fiber (Factor B) effect. Thus we can conclude at level of significance that there is a significant difference in mean nutritional ratings between cereals with a high fiber content and cereals with a low fiber content.
710
Question 12.140
stockindustry
24. A financial consultant is interested in differences in stock prices between industries and stock exchanges. She has collected a random sample of the stock prices of companies trading on the New York Stock Exchange and on NASDAQ, in the defense industry, the apparel industry, and the chemicals industry. Use level of significance to do the following:
- Test for interaction.
- If appropriate, test for difference in mean stock price among the industries.
- If appropriate, test for difference in mean stock price between the exchanges.
- For the results in (b) and (c), would anything change if we used level of significance instead?
| Company | Industry | Exchange | Stock price |
|---|---|---|---|
| Lockheed Martin | Defense | NYSE | 75.35 |
| General Dynamics | Defense | NYSE | 68.17 |
| Guess, Inc. | Apparel | NYSE | 42.30 |
| Van Heusen | Apparel | NYSE | 40.68 |
| Monsanto | Chemicals | NYSE | 81.75 |
| 3M Company | Chemicals | NYSE | 82.67 |
| Argon ST | Defense | NASDAQ | 21.71 |
| Elbit Systems | Defense | NASDAQ | 65.05 |
| Iconix Group | Apparel | NASDAQ | 12.67 |
| Perry Ellis | Apparel | NASDAQ | 15.06 |
| Gulf Resources | Chemicals | NASDAQ | 11.66 |
| Hawkins, Inc. | Chemicals | NASDAQ | 21.83 |