Section 14.7 Exercises
CLARIFYING THE CONCEPTS
Question 14.146
1. Describe what a sequence is. (p. 14-55
Question 14.147
2. Clearly describe what the runs test for randomness is used for. (p. 14-55
Question 14.148
3. Explain what a run is. (p. 14-55
Question 14.149
4. What does it mean if the number of runs in a sequence is too low or too high? (p. 14-56
PRACTICING THE TECHNIQUES
 CHECK IT OUT!
| To do | Check out | Topic |
|---|---|---|
| Exercises 5–8 | Example 23 | Notation used for the runs test for randomness |
| Exercises 9–20 | Example 24 | Conducting the runs test for randomness |
For Exercises 5–8, you are given sequences of data. Calculate the following:
- , the number of observations having the first distinct outcome
- , the number of observations having the second distinct outcome
- , the number of runs in the sequence
Question 14.150
5. M M F F F M F M F M M M M F M M M
Question 14.151
6. N N N N N N P P P P P P P P N N N N N N N
Question 14.152
7. T F T F T F F T T F T F T F T T F T F T F T F F F T F T F T F T F F T F T F T T T F
Question 14.153
8. Y Y N N Y Y Y N N Y Y N N N Y N N N N Y Y N N Y Y Y N N N N Y Y N N N N N Y Y Y Y Y Y Y
Question 14.154
9. Find and for the sequence in Exercise 5 for level of significance .
Question 14.155
10. Find and for the sequence in Exercise 6 for level of significance .
Question 14.156
11. Find the critical value for the sequence in Exercise 7 for level of significance .
Question 14.157
12. Find the critical value for the sequence in Exercise 8 for level of significance .
For Exercises 13 and 14, calculate the test statistic .
Question 14.158
13. For the sequence in Exercise 5
Question 14.159
14. For the sequence in Exercise 6
For Exercises 15 and 16, do the following:
- Calculate .
- Calculate .
- Compute the test statistic .
Question 14.160
15. For the sequence in Exercise 7
Question 14.161
16. For the sequence in Exercise 8
14-62
For Exercises 17–20, conduct the runs test for randomness using the following steps:
- State the hypotheses.
- Find the critical values.
- Calculate the test statistic.
- State the conclusion and the interpretation.
Question 14.162
17. Use the sequence in Exercise 5, the critical values in Exercise 9, the test statistic in Exercise 13, and level of significance .
Question 14.163
18. Use the sequence in Exercise 6, the critical values in Exercise 10, the test statistic in Exercise 14, and level of significance .
Question 14.164
19. Use the sequence in Exercise 7, the critical value in Exercise 11, the test statistic in Exercise 15, and level of significance .
Question 14.165
20. Use the sequence in Exercise 8, the critical value in Exercise 12, the test statistic in Exercise 16, and level of significance .
APPLYING THE CONCEPTS
Question 14.166
21. Florida Lottery Winners. The following sequence represents whether there is one (A) or more than one (B) winning ticket for the Florida Lotto Jackpot lottery for the year 2008. Test whether the A/B sequence is random, using level of significance .
Question 14.167
22. Boston Red Sox. The following sequence represents the last 15 games of the 2013 regular season, showing whether the Red Sox won (W) or lost (L) the game. Test whether the sequence is random, using level of significance .
Question 14.168
23. Nobel Prize Winners. The following sequence represents the nationality of the Nobel Prize in Economics winners (2000–2013), with A representing an American and O representing all other nationalities.14 Test whether the sequence is random, using level of significance .
Question 14.169
24. Super Bowl Winners. The following sequence represents the conference of the Super Bowl winners from 1967 to 2014, where A represents the American Football Conference and N represents the National Football Conference.15 Test whether the sequence is random, using level of significance .
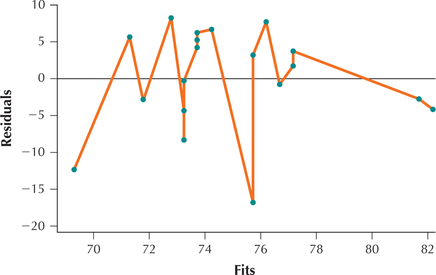
Question 14.170
25. Douglas Fir Trees: Annual Growth Versus Age. The following scatterplot depicts the residuals versus the fits from a regression of the annual growth of Douglas fir trees versus the age of the tree.16 Proceeding from left to right, classify each residual as either above zero (A) or below zero (B). Then perform the runs test to determine whether the independence assumption is violated, using level of significance .
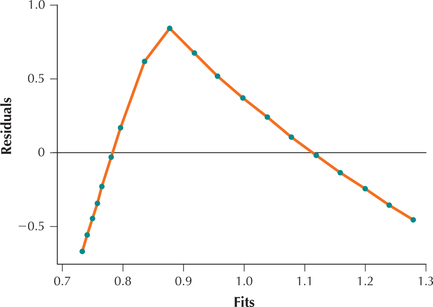
Question 14.171
26. Women's Pulse Rates versus Temperature. The following scatterplot depicts the residuals versus the fits from a regression of pulse rates versus body temperatures for a random sample of 20 women. Proceeding from left to right, classify each residual as either above zero (A) or below zero (B). Then perform the runs test to determine whether the independence assumption is violated, using level of significance .