Chapter 3 Review Exercises
section 3.1
CDC Funding. The following table contains the funding provided by the Centers for Disease Control (CDC) to all the states in New England, in order to fight HIV/AIDS. Use the data for Exercises 1–3.
| State | Funding ($ millions) |
|---|---|
| Connecticut | 7.8 |
| Maine | 1.9 |
| Massachusetts | 14.9 |
| New Hampshire | 1.5 |
| Rhode Island | 2.7 |
| Vermont | 1.6 |
Question 3.439
1. Find the mean.
3.99.1
$5.07 million
Question 3.440
2. Calculate the median.
Question 3.441
3. Suppose we added California, with $62.1 million in funding, to the data set. Recompute the mean and the median. Which is more affected by the presence of California? What can we say about each of the mean and the median, with respect to extreme values?
3.99.3
Mean = $13.21 million, Median = $2.7 million. The mean. The mean is affected by extreme values more than the median is.
Calories in Cereal. For Exercises 4–8, refer to the calories in breakfast cereals given in Table 23 (page 169).
Question 3.442
4. Compute the mean.
Question 3.443
5. Calculate the median.
3.99.5
110 calories
Question 3.444
6. Find the mode
Question 3.445
7. If we eliminated the cereals with 90 or less calories from the sample, which measure would not be affected at all? Why?
3.99.7
The mode, since the value with the largest frequency is unaffected by the deletion of values 90 or less.
Question 3.446
8. If we added 10 calories to each cereal, how would that affect the mean, median, and mode? Would it affect each of the measures equally?
section 3.2
CDC Funding to Fight HIV/AIDS. Refer to the CDC funding data above for Exercises 9–14. Omit California.
Question 3.447
9. Find the range of the data set.
3.99.9
$13.4 million
Question 3.448
10. For each state, find its deviation from the population mean.
Question 3.449
11. Calculate the average deviation. Would the average deviation be a good measure of spread? Why or why not?
3.99.11
No. It is always 0.
Question 3.450
12. Compute the sum of squared deviations. Then divide by the number of states. The result is the population variance, .
Question 3.451
13. Take the square root of the population variance to find the population standard deviation, .
3.99.13
$4.9080 million.
184
Question 3.452
14. Interpret the value for the standard deviation.
Calories in Cereal. For Exercises 14–17, refer to the calories in breakfast cereals given in Table 23 (page 169).
Question 3.453
15. Calculate the standard deviation of the sample.
3.99.15
11.6450 calories
Question 3.454
16. Suppose we consider the cereals in Table 23 to be representative of all breakfast cereals. Use the mean from Exercise 4 and the standard deviation from Exercise 15, along with Chebyshev's Rule, to find two values between which at least 75% of cereal calories will fall.
Question 3.455
17. Refer to the previous exercise. Now further assume the data distribution is bell-shaped. Find two values between which about 95% of cereal calories will fall.
3.99.17
85.88 calories, 132.46 calories
Common Syllables in English. Refer to the table shown here of some common syllables in English for Exercises 18–21.
| Syllable | Frequency |
|---|---|
| an | 462 |
| bi | 621 |
| sit | 104 |
| ed | 907 |
| its | 293 |
| est | 186 |
| wil | 470 |
| tiv | 136 |
| en | 675 |
| biz | 114 |
Question 3.456
syllables
18. Find the mean and the range of the syllable frequencies.
Question 3.457
syllables
19. Would you say that a typical distance from the mean for the frequencies is about 900, about 500, about 300, or about 100?
3.99.19
About 300.
Question 3.458
syllables
20. What is your best guesstimate of the value of a typical distance from the mean for the syllable frequencies?
Question 3.459
syllables
21. Find the sample variance and the sample standard deviation of syllable frequencies.
- How far is each from your estimate of the typical deviation earlier?
- Interpret the meaning of this value for the standard deviation so that someone who has never studied statistics would understand it.
3.99.21
Standard deviation = 276.2. (a) 24 (b) The frequency counts for the syllables typically differ from the mean of 396.8 by only 276.2.
section 3.3
Age Distribution of Twenty-Somethings. The following table shows the number of Americans (in millions) between 20 and 29 years old in 2011. Use this data for Exercises 22–25.
Question 3.460
22. Find the estimated mean age of twenty-somethings.
Question 3.461
23. Calculate the estimated standard deviation of Americans in their 20s.
3.99.23
2.89 years
Question 3.462
24. Use the Empirical Rule to find two age values between which fall about 68% of all American twenty-somethings.
Question 3.463
ages20s
25. Compare your answer in the previous exercise to the actual proportion of twenty-somethings whose ages lie between the values found in the previous exercise. What does this discrepancy mean, regarding the distribution of ages in the table?
| Age | Number (millions) |
|---|---|
| 20 | 4.5 |
| 21 | 4.4 |
| 22 | 4.3 |
| 23 | 4.2 |
| 24 | 4.2 |
| 25 | 4.3 |
| 26 | 4.2 |
| 27 | 4.2 |
| 28 | 4.2 |
| 29 | 4.2 |
3.99.25
59.48%. The distribution is not bell-shaped.
section 3.4
Ragweed Pollen. Use the table of ragweed pollen index in New York localities for Exercises 26–41. Are you allergic to ragweed pollen? You are not alone. The American Academy of Allergy maintains the ragweed pollen index, which details the severity of the pollen problem for hundreds of communities across the nation. The following table contains the ragweed pollen index on a particular day for 10 localities in New York State.
| Locality | Ragweed pollen index |
|---|---|
| Albany | 48 |
| Binghamton | 31 |
| Buffalo | 59 |
| Elmira | 43 |
| Manhattan | 25 |
| Rochester | 60 |
| Syracuse | 25 |
| Tupper Lake | 8 |
| Utica | 26 |
| Yonkers | 38 |
Find the following percentiles of total ragweed pollen index.
Question 3.464
ragweed
26. 10th percentile
Question 3.465
ragweed
27. 50th percentile
3.99.27
34.5
Question 3.466
ragweed
28. 90th percentile
For Exercises 29–31, find the -scores for the following localities for the ragweed pollen index.
Question 3.467
ragweed
29. Albany
3.99.29
0.7088
Question 3.468
ragweed
30. Rochester
Question 3.469
ragweed
31. Tupper Lake
3.99.31
–1.7145
Question 3.470
ragweed
32. Identify any outliers or moderately unusual observations in the ragweed pollen index.
For Exercises 33–35, find the percentile rank for the given ragweed pollen index.
Question 3.471
ragweed
33. 25
3.99.33
30th percentile
Question 3.472
ragweed
34. 59
Question 3.473
ragweed
35. 48
3.99.35
80th percentile
Question 3.474
ragweed
36. Find the first, second, and third quartiles of the ragweed pollen index.
185
Question 3.475
ragweed
37. Find the interquartile range. Interpret what this value means.
3.99.37
IQR = 23, which is the spread of the middle 50% of the data set
Question 3.476
ragweed
38. Detect any outliers using the IQR method.
section 3.5
Question 3.477
ragweed
39. Let's draw a boxplot of the ragweed pollen index.
- What is the five-number summary?
- By hand, draw a boxplot.
- Is the data set left-skewed, right-skewed, or symmetric?
- What should the symmetry or skewness mean in terms of the relative values of the mean and median?
- Find the mean and standard deviation. Is your prediction in (d) supported?
3.99.39
(a) Min = 8, Q1 = 25, median = 34.5, Q3 = 48, max = 60
(b)
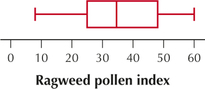
(c) Close to symmetric, slightly right-skewed. (d) The mean should be close to the median or a little above the median. (e) Mean = 36.30, standard deviation = 16.51. The value of the mean is slightly above the median of 34.50.
Question 3.478
ragweed
40. Detect any outliers using the IQR method. Compare with Exercise 32. Do the two methods concur or disagree?
Question 3.479
ragweed
41. Suppose the ragweed pollen index in Rochester were 600 instead of 60. How would this outlier affect the quartiles and the IQR? What property of these measures is this behavior an example of?
3.99.41
Unchanged; robustness