4.3 Further Topics in Regression Analysis
OBJECTIVES By the end of this section, I will be able to …
- Calculate the sum of squares error (SSE), and use the standard error of the estimate s as a measure of a typical prediction error.
- Describe how total variability, prediction error, and improvement are related to the total sum of squares (SST), the sum of squares error (SSE), and the sum of squares regression (SSR).
- Explain the meaning of the coefficient of determination as a measure of the usefulness of the regression.
In Section 4.2, we were introduced to regression analysis, which uses an equation to approximate the linear relationship between two quantitative variables. Here in Section 4.3, we learn some further topics that will enable us to better apply the tools of regression analysis for a deeper understanding of our data.
226
1 Sum of Squares Error (SSE) and Standard Error of the Estimate
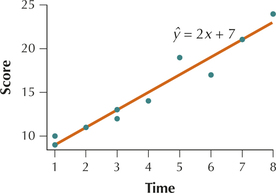
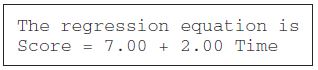
Table 6 shows the results for 10 student subjects who were given a set of short-term memory tasks to perform within a certain amount of time. These tasks included memorizing nonsense words and random patterns. Later, the students were asked to repeat the words and patterns, and the students were scored according to the number of words and patterns memorized and the quality of their memories. Partially remembered words and patterns were given partial credit, so the score was a continuous variable. Figure 31 displays the scatterplot of versus , together with the regression line , as calculated by Minitab.
shortmemory

| Student | Time to memorize (in minutes) |
Short-term memory score |
|---|---|---|
| 1 | 1 | 9 |
| 2 | 1 | 10 |
| 3 | 2 | 11 |
| 4 | 3 | 12 |
| 5 | 3 | 13 |
| 6 | 4 | 14 |
| 7 | 5 | 19 |
| 8 | 6 | 17 |
| 9 | 7 | 21 |
| 10 | 8 | 24 |
In Section 4.2, we learned that the difference represented the prediction error or residual between the actual data value and the predicted value . For example, for a student who is given , the predicted score is .
For Student 7, who was given 5 minutes to study and got a score of 19, the prediction error is .
We can calculate the prediction errors for every student who was tested. If we wish to use the regression to make useful predictions, we want to keep all our prediction errors small. To measure the prediction errors, we calculate the sum of squared prediction errors, or more simply, the sum of squares error (SSE):
Sum of Squares Error (SSE)
We want our prediction errors to be small, therefore, it follows that we want SSE to be as small as possible.
Least-Squares Criterion
The least-squares criterion states that the regression line will be the line for which the SSE is minimized. That is, out of all possible straight lines, the least-squares criterion chooses the line with the smallest SSE to be the regression line.
227
EXAMPLE 12 Calculating SSE, the sum of squares error
- Construct a scatterplot of the memory score data, indicating each residual.
- Calculate SSE for the memory score data.
Solution
- The brackets (}) in the scatterplot in Figure 32 indicate the residual for each student’s score. The quantities represented by these brackets are the residuals .
Table 7 shows the -values and residuals for the data in Table 6. The SSE is then found by squaring each residual and taking the sum. Thus,
We know that is the regression line, according to the least-squares criterion, so no other possible straight line would result in a smaller SSE.
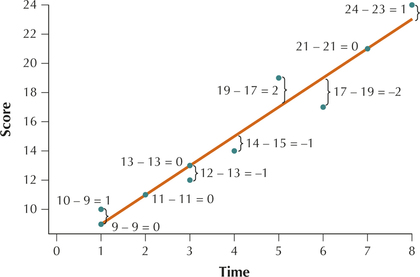 Figure 4.32: FIGURE 32 Scatterplot showing the prediction errors or residuals .
| Student | Time | Actual score |
Predicted score |
Residual |
(Residual)2 |
|---|---|---|---|---|---|
| 1 | 1 | 9 | 9 | 0 | 0 |
| 2 | 1 | 10 | 9 | 1 | 1 |
| 3 | 2 | 11 | 11 | 0 | 0 |
| 4 | 3 | 12 | 13 | −1 | 1 |
| 5 | 3 | 13 | 13 | 0 | 0 |
| 6 | 4 | 14 | 15 | −1 | 1 |
| 7 | 5 | 19 | 17 | 2 | 4 |
| 8 | 6 | 17 | 19 | −2 | 4 |
| 9 | 7 | 21 | 21 | 0 | 0 |
| 10 | 8 | 24 | 23 | 1 | 1 |
NOW YOU CAN DO
Exercises 11a–22a.
A useful interpretive statistic is , the standard error of the estimate. The formula for follows.
228
Standard Error of the Estimate
 Don’t confuse this use of the notation for the standard error of the estimate with the use of the notation for the sample standard deviation.
The standard error of the estimate gives a measure of the typical residual. That is, is a measure of the size of the typical prediction error, which is the typical difference between the predicted value of and the actual observed value of . If the typical prediction error is large, then the regression line may not be useful.
EXAMPLE 13 Calculating and interpreting , the standard error of the estimate
Calculate and interpret the standard error of the estimate for the memory score data.
Solution
and , so
Thus, the typical error in prediction is 1.2247 points. In other words, if we know the amount of time a given student spent memorizing, then our estimate of the student’s score on the short-term memory test will typically differ from the student’s actual score by only 1.2247 points.
Note: Here, we are rounding for reporting purposes. However, when we use for calculating other quantities later, we will not round until the last calculation.
NOW YOU CAN DO
Exercises 11b–22b.
2 SST, SSR, and SSE
The least-squares criterion guarantees that the value of that we found in Example 12 is the smallest possible value for SSE, given the data in Table 6. However, this guarantee in itself does not tell us that the regression is useful. For the regression to be useful, the prediction error (and therefore SSE) must be small. But, we cannot yet tell whether the value of is indeed small because we can’t compare it to anything.
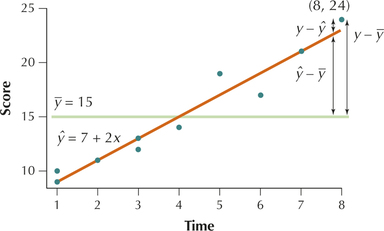
Suppose for a moment that we want to estimate short-term memory scores, but we have no knowledge of the amount of time for memorization. Then the best estimate for is simply , the mean of the sample of short-term memory test scores. The graph of is the horizontal line in Figure 33.
229
In general, the data points are closer to the regression line than they are to the horizontal line , indicating that the errors in prediction are smaller when using the regression equation. Consider Student 10, who had a short-term memory score of after memorizing for minutes. Using as the estimate, the error for Student 10 is
This error is shown in Figure 33 as the vertical distance .
Suppose we found this value for every student in the data set and summed the squared , just as we did for the when finding SSE. The resulting statistic is called the total sum of squares (SST) and is a measure of the total variability in the values of the variable:
Developing Your Statistical Sense
Relationship Between SST and the Variance of the 's
Note that SST ignores the presence of the information; it is simply a measure of the variability in . Recall (see page 133) that the variance of a sample of -values is given by . Thus,
Thus, SST is proportional to the variance of the ’s and, as such, is a measure of the variability in the data.
EXAMPLE 14 Calculating SST, the total sum of squares, in two ways
Calculate SST, the total sum of squares, for the memory score data in two ways:
- By using Table 8
- By using the fact that the sample variance of the score data (the -values) equals
Solution
- Table 8 shows the values for for the data in Table 7. Thus, .
- When we are given the variance of , we may calculate SST as follows:
| Student | Score | ||
|---|---|---|---|
| 1 | 9 | −6 | 36 |
| 2 | 10 | −5 | 25 |
| 3 | 11 | −4 | 16 |
| 4 | 12 | −3 | 9 |
| 5 | 13 | −2 | 4 |
| 6 | 14 | −1 | 1 |
| 7 | 19 | 4 | 16 |
| 8 | 17 | 2 | 4 |
| 9 | 21 | 6 | 36 |
| 10 | 24 | 9 | 81 |
NOW YOU CAN DO
Exercises 11c–22c.
230
Consider Figure 33 once again. For Student 10, note that the error in prediction when ignoring the data is , while the error in prediction when using the regression equation is . (Recall that because Student 10’s time is .) The amount of improvement (that is, the amount by which the prediction error is diminished) is the difference between and :
Once again, we can find for each observation in the data set, square them, and sum the squared results to obtain . The resulting statistic is SSR, the sum of squares regression.
SSR measures the amount of improvement in the accuracy of our estimates when using the regression equation compared with relying only on the -values and ignoring the information. Note in Figure 33 that the distance is the same as the sum of the distances and . It can be shown, by using algebra, that the following also holds true.
Relationship Among SST, SSR, and SSE
Note: None of these sums of squares can ever be negative.
If any two of these sums of squares are known, the third can also be calculated, as shown in the following example.
EXAMPLE 15 Using SST and SSE to find SSR
Use SST and SSE to find the value of SSR for the data from Examples 12–14.
Solution
From Example 12, we have , and from Example 14 we have . That leaves us with just one unknown in the equation , so we can solve for the unknown SSR:
NOW YOU CAN DO
Exercises 11d–22d.
3 Coefficient of Determination
SSR represents the amount of variability in the response variable that is accounted for by the regression equation, that is, by the linear relationship between and . SSE represents the amount of variability in the that is left unexplained after accounting for the relationship between and (including random error). We know that SST represents the sum of SSR and SSE; therefore, it makes sense to consider the ratio of SSR and SST, which is called the coefficient of determination .
The coefficient of determination measures the goodness of fit of the regression equation to the data. We interpret as the proportion of the variability in that is accounted for by the linear relationship between and . The values that can take are . Note that the coefficient of determination is the square of the correlation coefficient . Thus, , the correlation coefficient.
231
EXAMPLE 16 Calculating and interpreting the coefficient of determination
Calculate and interpret the value of the coefficient of determination for the memory score data.
Solution
From Example 14, we have , and from Example 15 we have . Thus,
Therefore, 94.74% of the variability in the memory test score is accounted for by the linear relationship between score and the time given for study .
NOW YOU CAN DO
Exercises 11e–22e.
What Does This Number Mean?
What does the value of ? Consider that the memory test scores have a certain amount of variability: some scores are higher than others. In addition to the amount of time given for memorizing, there may be several other factors that might account for variability in the scores, such as the memorizing ability of the students, how much sleep the students had, and so on. However, indicates that 94.74% of this variability in memory scores is explained by the single factor “amount of time given for study” . All other factors, including factors such as amount of sleep, account for only of the variability in the memory test scores.
Suppose that the regression equation was a perfect fit to the data, so that every observation lies exactly on the regression line. No errors in prediction would occur; therefore, SSE would equal 0, which would imply that
In this case, , then
Conversely, if , then no improvement at all is gained by using the regression equation. That is, the regression equation accounts for no variability at all, and .
The closer the value of is to 1, the better the fit of the regression equation to the data set. A value near 1 indicates that the regression equation fits the data extremely well. A value near 0 indicates that the regression equation fits the data extremely poorly.
Recall from Section 4.1 that the correlation coefficient is given by
where and represent the sample standard deviation of the data and the data, respectively. We can express the correlation coefficient as
where is the coefficient of determination. The correlation coefficient takes the same sign as the slope . If the slope of the regression equation is positive, then ; if the slope of the regression equation is negative, then .
232
EXAMPLE 17 Calculate the correlation coefficient using
Use to calculate the value of the correlation coefficient for the memory score data.
Solution
The slope , which is positive, tells us that the sign of the correlation coefficient is positive. Thus,
Therefore, student scores on the short-term memory test are strongly positively correlated with the amount of time allowed for memorization.
NOW YOU CAN DO
Exercises 11f–22f.