STEP-BY-STEP TECHNOLOGY GUIDE: Scatterplots and Correlation
sqrfootsale
TI-83/84
Constructing a Scatterplot for Data in Table 1 (p. 189)
- Step 1 Enter the x variable (square footage) into L1 and the y variable (sales price) into L2.
- Step 2 Press 2nd, then Y = for the STAT PLOTS menu.
- Step 3 Select 1: and press ENTER. Select ON, and press ENTER.
- Step 4 Select the scatterplots icon (see Figure 15), and press ENTER.
- Step 5 Select L1 for Xlist, and L2 for Ylist.
- Step 6 Press ZOOM, choose 9:ZoomStat, and press ENTER. The scatterplot is shown in Figure 16.
Correlation Coefficient r
- Step 1 Turn on the diagnostics as follows:. Press 2nd 0 (catalog). Then scroll down and select DiagnosticOn. Press ENTER twice to turn the diagnostics on. This will give you more output results for regression and correlation.
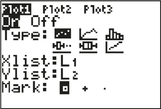 Figure 4.15: FIGURE 15
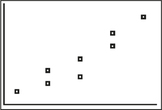 Figure 4.16: FIGURE 16
 - Step 2 Enter your x data into L1 and your y data into L2.
- Step 3 Press STAT, select CALC, and select LinReg (ax+b). Press ENTER twice to get the results. The correlation coefficient r is given, among other statistics used in regression.
EXCEL
Scatterplots
- Step 1 Enter your x variable and your y variable in two neighboring columns, with the x variable on the left. Make sure the first entry in each column is the variable name. Select the two columns.
- Step 2 Click Insert > Insert Scatter (X,Y) or Bubble Chart (in Chart section), then click Scatter. See Figure 17.
Correlation Coefficient r
- Step 1 Make sure the Data Analysis add-in is activated. Click Data > Data Analysis, then select Correlation and click OK.
- Step 2 Click on the box next to Input Range, then highlight the data, select Labels in First Row, and click OK.
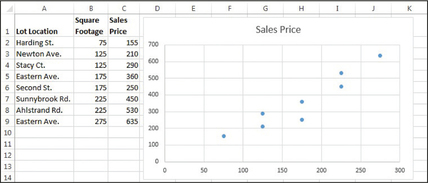 Figure 4.17: FIGURE 17 Excel scatterplot.
MINITAB
Scatterplots
- Step 1 Enter the data into two columns.
- Step 2 Click Graph > Scatterplot…. Select Simple and click OK.
- Step 3 Click on the cell under Y variables, and double-click on your y variable; then click on the cell under X variables, and double-click on your x variable. Then click OK.
Correlation Coefficient r
- Step 1 Enter your x data into column C1 and your y data into column C2.
- Step 2 Click on Stat, highlight Basic Statistics, and select Correlation…
- Step 3 Choose C1 and C2 and click OK.
SPSS
Scatterplots
- Step 1 Enter the data into two columns.
- Step 2 Graphs > Chart Builder. Click OK, then Scan Data.
- Step 3 In the Gallery tab, find the Choose from menu and select Scatter/Dot. Drag Simple scatter to the chart preview area, and close the Element Properties box.
- Step 4 Drag the x variable to “X-Axis?” and the y variable to “Y-Axis?” Click OK.
Correlation Coefficient r
- Step 1 Enter the data into two columns.
- Step 2 Click on Analyze > Correlate > Bivariate....
- Step 3 Move the variables to the Variables box, and click OK.
200
JMP
Scatterplots
- Step 1 Click File > New > Data Table. Enter the data into two columns.
- Step 2 Graph > Chart Builder. Drag the x variable to the X box, and the y variable to the Y box. De-select the Smoother option above the graph. Click Done.
Correlation Coefficient r
- Step 1 Click File > New > Data Table. Enter the data into two columns.
- Step 2 Click Analyze > Multivariate Methods > Multivariate. Move both variables into the Y, Columns area. Click OK. The results are displayed in the Correlations section.
CRUNCHIT!
We will use the data from Example 2 (p. 189).
Scatterplots
- Step 1 Click File, highlight Load from Larose, Discostat3e > Chapter 4, and click on Example 01_02.
- Step 2 Click Graphics and select Scatterplot. For X, select the predictor (x) variable Square footage (100s of sq.ft.). For Y, select the response (y) variable Sales price ($1000s). In the Show menu under Parameters, choose Points. Click Calculate.
Correlation Coefficient r
- Step 1 Click File, highlight Load from Larose, Discostat3e > Chapter 4, and click on Example 01_02.
- Step 2 Click Statistics and select Correlation.
- Step 3 Click the boxes next to Square footage (100s of sq.ft.) and Sales price ($1000s). Then click Calculate.