STEP-BY-STEP TECHNOLOGY GUIDE: Finding Areas, Probabilities, and Percentiles for Any Normal Distribution, and Constructing Normal Probability Plots
380
TI-83/84
Finding Areas or Probabilities for Any Normal Distribution
- Step 1 Press 2nd, then DISTR (the VARS key).
- Step 2 Press 2 to choose normalcdf(.
- Step 3 On the home screen, enter the smaller value of X, comma, the larger value of X, comma, the mean of X, comma, the standard deviation of X, then close parenthesis. See Figure 55 (page 375).
Step 4 Press ENTER.
Note: When finding the area to the right of a value of X, use 1E99 as the larger value. When finding the area to the left of a value of X, use −1E99 as the smaller value. Also, the shortcut for using the standard normal distribution is to specify only the lower and higher values of X. If you enter only two values, the calculator assumes you want the standard normal distribution.
Finding Percentiles for Any Normal Distribution
- Step 1 Press 2nd, then DISTR (the VARS key).
- Step 2 Press 3 to choose invNorm(.
- Step 3 On the home screen, enter the probability value or area, then the mean of X, then the standard deviation of X, and then close parenthesis. See Figure 56 (page 375).
Step 4 Press ENTER.
Note: A shortcut for finding standard normal percentiles is to enter only the value of the percentile for this function, in which case the calculator assumes you want the standard normal distribution.
Note: Not all TI-83/84s have the invNorm function.
Constructing Normal Probability Plots
Assume that the data set is in list L1.
- Step 1 Access STAT PLOTS by pressing 2nd > Y=.
- Step 2 Select 1: beside Plot1. Press ENTER.
- Step 3 Move the cursor over On, and press ENTER.
- Step 4 Select the normal probability plot type by moving the cursor to the lower-right plot among the choices for Type. Press ENTER.
- Step 5 For Data List, enter L1.
- Step 6 For Data Axis, choose X.
- Step 7 Press ZOOM, then 9: ZoomStat.
EXCEL
Finding Areas or Probabilities for Any Normal Distribution
- Step 1 Select cell A1, and click the Insert Function icon Fx.
- Step 2 In the Search for a function, type NORMDIST, click GO, then OK.
- Step 3 For X, enter the X-value for which you want to find the probability. For Mean, enter the value of μ. For Standard_dev, enter the value of σ. For Cumulative, always enter true. Click OK. See Figure 57 (page 375).
- Step 4 Excel provides the cumulative probability: (see Example 42). If you need to find , subtract the result from 1. If you need to find , find the two cumulative probabilities, and subtract the lesser from the greater, as in Example 42.
Finding Percentiles for Any Normal Distribution
- Step 1 Select cell A1, and click the Insert Function icon Fx.
- Step 2 In the Search for a function, type NORMINV, click GO, then OK.
- Step 3 For Probability, enter the desired percentile in decimal form (for example, 0.99). For Mean, enter the value of μ. For Standard_dev, enter the value of σ. Click OK. See Figure 59 (page 376).
MINITAB
Finding Areas or Probabilities for Any Normal Distribution
- Step 1 Click Calc > Probability Distributions > Normal….
- Step 2 Select Cumulative Probability, and enter the mean μ and standard deviation σ.
- Step 3 Select Input Constant, and enter the X-value for which you want to find the probability. Click OK.
- Step 4 Minitab provides the cumulative probability: (see Figure 60 on page 376). If you need to find , subtract the result from 1. If you need to find , find the two cumulative probabilities, and subtract the lesser from the greater, as in Example 42.
Finding Percentiles for Any Normal Distribution
- Step 1 Click Calc > Probability Distributions > Normal….
- Step 2 Select Inverse Cumulative Probability, and enter the mean μ and standard deviation σ.
- Step 3 Select Input Constant. For the constant, enter the desired percentile in decimal form (for example, 0.99). See Figure 62 (page 376).
Constructing Normal Probability Plots
Assume that the data set is in column C1.
- Step 1 From the menu bar, select Graph, and then click Probability Plot….
- Step 2 Select Single, and click OK.
- Step 3 In the Probability Plot dialog box, select C1, and click OK. The normal probability plot for the data set in C1 is then generated.
381
SPSS
Finding Areas or Probabilities for Any Normal Distribution
- Step 1 Enter a number into the first element of the spreadsheet. Click Transform > Compute Variable….
- Step 2 Enter the name of the first column under Target Variable. Under Function Group, select CDF & Noncentral CDF, and under Functions and Special Variables, double-click Cdf.Normal.
- Step 3 Under Numeric Expression, replace the three question marks with the X-value for which you want to find the probability, the mean μ, and standard deviation σ. Click OK, then click OK, and minimize the output window.
- Step 4 SPSS provides the cumulative probability: . If you need to find , subtract the result from 1. If you need to find , find the two cumulative probabilities and subtract the lesser from the greater, as in Example 42.
Finding Percentiles for Any Normal Distribution
- Step 1 Enter a number into the first element of the spreadsheet. Click Transform > Compute Variable….
- Step 2 Enter the name of the first column under Target Variable. Under Function Group, select Inverse DF, and under Functions and Special Variables, double-click Idf.Normal.
- Step 3 Under Numeric Expression, replace the three question marks with the desired percentile in decimal form (for example, 0.99), the mean μ, and standard deviation σ. Click OK, then click OK, and minimize the output window.
Constructing Normal Probability Plots
Assume that the data set is in the first column.
- Step 1 Click Analyze > Descriptive Statistics > Explore….
- Step 2 Move the first column to the Dependent List box.
- Step 3 Select Plots…, and select Normal plots with tests. Click Continue.
- Step 4 Under Display, select Plots. Click OK. The first plot shown in the Output window is the Normal Probability Plot.
JMP
Finding Areas or Probabilities for Any Normal Distribution
- Step 1 Click File > New > Data Table. Double-click the first element in Column 1, and then select Column 1.
- Step 2 Click Cols > Formula…. Under Functions (grouped), click Probability > Normal Distribution.
- Step 3 Double-click on Normal Distribution in the formula. Inside the parentheses, enter the X-value for which you want to find the probability, the mean μ, and standard deviation σ. Click OK.
- Step 4 JMP provides the cumulative probability: (see Figure 63 on page 377). If you need to find , subtract the result from 1. If you need to find , find the two cumulative probabilities, and subtract the lesser from the greater, as in Example 42.
Finding Percentiles for Any Normal Distribution
- Step 1 Click File > New > Data Table. Double-click the first element in Column 1, and then select Column 1.
- Step 2 Click Cols > Formula…. Under Functions (grouped), click Probability > Normal Quantile.
- Step 3 Double-click on Normal Quantile in the formula. Inside the parentheses, enter the desired percentile in decimal form (for example, 0.99), the mean μ, and standard deviation σ. Click OK. See Figure 65 (page 377).
Constructing Normal Probability Plots
- Step 1 Select File > New > Data Table. Assume that the data set is in Column 1.
- Step 2 Select Analyze > Distribution. Click Column 1 under Select Columns, and then click Y, Columns. Click OK.
- Step 3 Click on the red triangle beside Column 1, and select Normal Quantile Plot. Figure 70 shows the output.
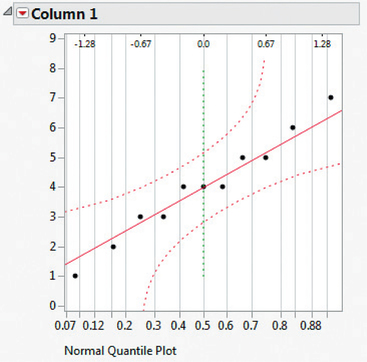 Figure 6.72: FIGURE 70 JMP normal probability plot.
CRUNCHIT!
We will use the Toyota Camry XLE data from Example 41 (page 373).
Finding Areas or Probabilities for Any Normal Distribution
- Step 1 Click Distribution calculator > Normal.
- Step 2 For mean, enter 28720. For sd, enter the standard deviation 1000.
- Step 3 Select ≤ and enter 30000. Click Calculate. The result shown is .
- Step 4 Delete 30000 and enter 27000. Click Calculate. The result shown is . The answer will then be .
Finding Percentiles for any Normal Distribution
- Step 1 Click Distribution calculator > Normal.
Step 2 For mean, enter 28720. For sd, enter the standard deviation 1000.
382
- Step 3 Select Quantile. Enter the desired percentile in decimal form. For the 99th percentile, enter 0.99 and click Calculate.
Constructing Normal Probability Plots
We will use the data from Example 43.
- Step 1 Click File, then highlight Load from Larose, Discostat3e > Chapter 6, and click on Example 06_43.
- Step 2 Click Graphics and select QQ Plot. For Sample, select POTASS. Then click Calculate.