Section 8.3 Exercises
CLARIFYING THE CONCEPTS
Question 8.178
1. Suppose the population proportion of successes is known. Is it useful to construct a confidence interval for ? (p. 463)
8.3.1
No, unless there is some reason to suspect that the value of has changed.
Question 8.179
2. A news broadcast mentions that the sample size of a poll is about 1000 and that the margin of error is plus or minus 3 percentage points. How do we know that the pollsters are using a 95% confidence level? (p. 467)
PRACTICING THE TECHNIQUES
 CHECK IT OUT!
| To do | Check out | Topic |
|---|---|---|
| Exercises 3–6 | Example 17 | Sample proportion as point estimate |
| Exercises 7–22 | Example 18 |
interval for population proportion |
| Exercises 21–32 | Example 20 | Margin of error for the -interval for |
| Exercises 33–38 | Example 21 | Sample size for estimating when is known |
| Exercises 39–46 | Example 22 | Sample size for estimating when is not known |
For Exercises 3–6, calculate the point estimate of the population proportion .
Question 8.180
3. Sample size = 250, number of successes = 90
8.3.3
0.36
Question 8.181
4. Sample size = 100, number of successes = 20
Question 8.182
5. ,
8.3.5
0.5844
Question 8.183
6. ,
For Exercises 7–20, do the following:
- Find .
- Determine whether the conditions for constructing a confidence interval for are met.
- If the conditions are met, construct a confidence interval for with the indicated confidence level.
- If the conditions are met, sketch the confidence interval using a graph similar to Figure 27 on page 465.
Question 8.184
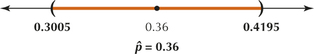
7. Confidence level 95%, sample size 250, number of successes = 90
8.3.7
(a) (b) Conditions are met. (c) (0.3005, 0.4195)
(d)
Question 8.185
8. Confidence level 95%, sample size 250, number of successes = 1
Question 8.186
9. Confidence level = 95%, sample size = 100, number of failures = 4
8.3.9
(a) (b) Conditions are not met. (c) Can't do. (d) Can't do.
Question 8.187
10. Confidence level = 99%, sample size = 100, number of successes = 20
Question 8.188
11. Confidence level 95%, ,
8.3.11
(a) (b) Conditions are not met. (c) Can't do. (d) Can't do
Question 8.189
12. Confidence level 95%, ,
471
Question 8.190
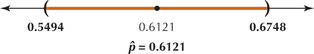
13. Confidence level 95%, ,
8.3.13
(a) (b) Conditions are met. (c) (0.5494, 0.6748)
(d)
Question 8.191
14. Confidence level 95%, ,
Question 8.192
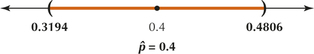
15. Confidence level 90%, ,
8.3.15
(a) (b) Conditions are met. (c) (0.3194, 0.4806)
(d)
Question 8.193
16. Confidence level 90%, ,
Question 8.194
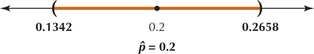
17. Confidence level 90%, ,
8.3.17
(a) (b) Conditions are met. (c) (0.1342, 0.2658)
(d)
Question 8.195
18. Confidence level 90%, ,
Question 8.196
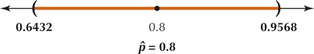
19. Confidence level 95%, ,
8.3.19
(a) (b) Conditions are met. (c) (0.6432, 0.9568)
(d)
Question 8.197
20. Confidence level 99%, ,
For Exercises 21–23, calculate the margin of error for the confidence interval from the indicated exercise.
Question 8.198
21. Exercise 15
8.3.21
0.0806
Question 8.199
22. Exercise 16
Question 8.200
23. Exercise 17
8.3.23
0.0658
Question 8.201
24. Refer to Exercises 21–23.
- Write a sentence describing what happens to the margin of error as the sample proportion decreases, whereas the sample size and confidence level stay the same.
- What effect does the behavior you observed in (a) have on the width of the confidence interval?
For Exercises 25–27, calculate the margin of error for the confidence interval from the indicated exercise.
Question 8.202
25. Exercise 18
8.3.25
0.1316
Question 8.203
26. Exercise 19
Question 8.204
27. Exercise 20
8.3.27
0.2061
Question 8.205
28. Refer to Exercises 25–27.
- Write a sentence describing what happens to the margin of error as the confidence level increases, while the sample size and the sample proportion stay the same.
- What effect does the behavior you observed in (a) have on the width of the confidence interval?
Question 8.206
29. For the following samples, find the margin of error for a 95% confidence interval for :
- 5 successes in 10 trials
- 50 successes in 100 trials
- 500 successes in 1000 trials
- 5000 successes in 10,000 trials
8.3.29
(a) 0.3099 (b) 0.098 (c) 0.0310 (d) 0.0098
Question 8.207
30. For the following samples, find the margin of error for a 95% confidence interval for :
- 10 successes in 100 trials
- 20 successes in 100 trials
- 30 successes in 100 trials
- 40 successes in 100 trials
- 50 successes in 100 trials
Question 8.208
31. Refer to Exercise 29.
- Write a sentence describing what happens to the margin of error as the sample size increases while remains constant.
- What effect will the behavior you observed in (a) have on the width of the confidence interval?
8.3.31
(a) Since the margin of error is , an increase in the sample size while remains constant results in a decrease in the margin of error. (b) Since the width of the confidence interval is 2 , an increase in the sample size while remains constant results in a decrease in the width of the confidence interval.
Question 8.209
32. Refer to Exercise 30.
- Write a sentence describing what happens to the margin of error as the sample proportion approaches 0.5 while the sample size remains constant.
- What effect will the behavior you observed in (a) have on the width of the confidence interval?
For Exercises 33–37, we are estimating and we know the value of . Find the required sample size.
Question 8.210
33. Confidence level 95%, margin of error 0.03,
8.3.33
897
Question 8.211
34. Confidence level 95%, margin of error 0.03,
Question 8.212
35. Confidence level 95%, margin of error 0.03,
8.3.35
385
Question 8.213
36. Confidence level 95%, margin of error 0.03,
Question 8.214
37. Confidence level 95%, margin of error 0.03,
8.3.37
5
Question 8.215
38. Using Exercises 33–37, describe what happens to the required sample size when gets very small.
For Exercises 39–44, we are estimating and we do not know the value of . Find the required sample size.
Question 8.216
39. Confidence level 90%, margin of error 0.03
8.3.39
752
Question 8.217
40. Confidence level 95%, margin of error 0.03
Question 8.218
41. Confidence level 99%, margin of error 0.03
8.3.41
1844
Question 8.219
42. Confidence level 95%, margin of error 0.015
Question 8.220
43. Confidence level 95%, margin of error 0.0075
8.3.43
17,074
Question 8.221
44. Confidence level 95%, margin of error 0.00375
Question 8.222
45. Using Exercises 39–41, describe what happens to the required sample size as the confidence level increases.
8.3.45
Increases
Question 8.223
46. Using Exercises 42–44, describe what happens to the required sample size when the margin of error is halved and the confidence level stays constant.
APPLYING THE CONCEPTS
For Exercises 47–50, do the following:
- Find .
- Determine whether the conditions are met for constructing a confidence interval for .
- If the conditions are met, construct and interpret a confidence interval for with the indicated confidence level, and sketch the confidence interval on the number line. If the conditions are not met, state why not.
Question 8.224
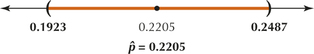
47. Married Millennials. Millennials refers to the generation of young people ages 18–29 in 2010, because they are the first generation to come of age in the new millennium. A 2010 Pew Research Center study found that 183 of a sample of 830 American millennials were married. Use a 95% confidence level.
8.3.47
(a) (b) Conditions are met. (c) (0.1923, 0.2487). We are 95% confident that , the population proportion of millennials who are married, lies between 0.1923 and 0.2487.
Question 8.225
48. Rather Be Fishing? A study found that Minnesota, at 38%, leads the nation in the proportion of people who go fishing.17 Assume that the study sample size was 100 and use a 90% confidence level.
Question 8.226
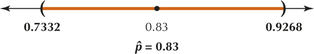
49. Spring Break and Drinking. A study released by the American Medical Association found that 83% of college female respondents agreed that heavier drinking occurs on spring break trips than is typically found on campus. Assume that the sample size was 100 and use a 99% confidence level.
8.3.49
(a) (b) Conditions are met. (c) (0.7332, 0.9268). We are 99% confident that , the population proportion of college females who agree that heavier drinking occurs on spring break trips than is typically found on campus, lies between 0.7332 and 0.9268.
Question 8.227
50. NASCAR Fans and Pickup Trucks. American Demographics magazine reported that 40% of a sample of NASCAR racing attendees said they owned a pickup truck. Suppose the sample size was 1000. Construct a 90% confidence interval for the population proportion of NASCAR racing attendees who own a pickup truck.
For Exercises 51–54, do the following for the confidence interval from the indicated exercises:
- Calculate the margin of error.
- Explain what this value for the margin of error means.
472
Question 8.228
51. Married Millennials. Exercise 47
8.3.51
(a) 0.0282 (b) We can estimate the population proportion of millennials who are married to within 0.0282 with 95% confidence.
Question 8.229
52. Rather Be Fishing? Exercise 48
Question 8.230
53. Spring Break and Drinking. Exercise 49
8.3.53
(a) 0.0968 (b) We can estimate the population proportion of college females who agree that heavier drinking occurs on spring break trips than is typically found on campus to within 0.0968 with 99% confidence.
Question 8.231
54. NASCAR Fans and Pickup Trucks. Exercise 50
For Exercises 55–58, software output for confidence intervals for are provided. Assume the conditions are met. For each, examine the indicated software output, and do the following:
- Report the confidence interval in the form “(lower bound, upper bound).”
- Interpret the confidence interval.
- Calculate the margin of error for the confidence interval.
- Interpret the margin of error.
Question 8.232
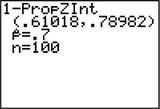
55. Successful Weather Predictions. TI-83/84 results for a 95% confidence interval for , the population proportion of times the weather forecaster correctly predicted rain.
8.3.55
(a) (0.61018, 0.78982) (b) We are 95% confident that , the population proportion of times the weather forecaster correctly predicted rain, lies between 0.61018 and 0.78982. (c) 0.08982 (d) We can estimate the population proportion of times the weather forecaster correctly predicted rain to within 0.08982 with 95% confidence.
Question 8.233
56. Credit Card Purchases. Minitab results for a confidence interval for , the population proportion of clothing store purchases made with a credit card.

Question 8.234
57. Web Buyers. SPSS results for a confidence interval for , the population proportion of clothing store purchases made online.
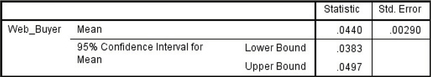
8.3.57
(a) (0.0383, 0.0497) (b) We are 95% confident that , the population proportion of clothing store purchases made online, lies between 0.0383 and 0.0497. (c) 0.0057 (d) We can estimate the population proportion of clothing store purchases made online to within 0.0057 with 95% confidence.
Question 8.235
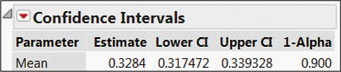
58. Coupon Users. JMP results for a confidence interval for , the population proportion of clothing store purchases made using a coupon.
Question 8.236
59. Hawaii Residents Thriving. The Gallup Organization collects data on the well-being of residents in the 50 states. In 2011, the highest proportion of residents that are reported to be “thriving” is in Hawaii, with 65.5% thriving. (Gallup categorizes respondents as thriving who report fewer health problems; fewer sick days; lower levels of stress, sadness, and anger; and higher levels of happiness and respect.) Suppose the poll is based on 1000 Hawaii residents.18
- Find the margin of error using a 99% confidence level. What does this number mean?
- Construct and interpret a 99% confidence interval for the population proportion of all Hawaiians who are thriving.
8.3.59
(a) 0.0387 (b) We can estimate the population proportion of Hawaii residents who are thriving to within 0.0387 with 99% confidence. (c) (0.6163, 0.6937) (d) We are 99% confident that , the population proportion of Hawaii residents who are thriving, lies between 0.6163 and 0.6937.
Question 8.237
60. Online Closeness. According to a Pew Research Center study, 21% of cell phone owners or Internet users in a committed relationship have felt closer to their spouse or partner because of exchanges they had online or via text message.19 How large a sample size is needed to estimate the population proportion of such people to within 1% with 99% confidence?
Question 8.238
61. Mozart Effect. Harvard University's Project Zero (https://pz.harvard.edu) found that listening to certain kinds of music, including Mozart, improved spatial-temporal reasoning abilities in children. Suppose that, in a sample of 100 randomly chosen fifth-graders, 65 performed better on a spatial-temporal achievement test after listening to a Mozart sonata. If appropriate, find a 95% confidence interval for the population proportion of all fifth-graders who performed better after listening to a Mozart sonata.
8.3.61
(0.5565, 0.7435)
Question 8.239
 62. Mozart Effect. Refer to Exercise 61. What if we increase the confidence level to 99% while changing nothing else? Explain what would happen to the following statistics and why:
- Margin of error
- Width of the confidence interval
The Famous Percentage Points. Use the information from Example 20 for Exercises 63 and 64.
Question 8.240
63. What if the sample size is higher than 1012, but otherwise everything else is the same as in the example? How would this affect the following?
- Margin of error
- Width of the confidence interval
8.3.63
(a) Decrease (b) Unchanged (c) Decrease
Question 8.241
64. What if the confidence level is lower than 95%, but otherwise everything else is the same as in the example? How would this affect the following?
- Margin of error
- Width of the confidence interval
BRINGING IT ALL TOGETHER
Health Effects of the Deepwater Horizon Oil Spill. The Deepwater Horizon oil drilling platform exploded on April 20, 2010, killing 11 workers and causing the largest oil spill in American history. Many Americans participated in the cleanup of coastal property and wildlife habitat, including the cleaning of the wildlife. The National Institute for Occupational Safety and Health (NIOSH) conducted a randomly sampled survey of 54 of these workers who were exposed to oil, dispersant, cleaners, and other chemicals. Of these 54 workers, 25 reported skin problems, such as itchy skin or rash, as a result of exposure to these chemicals. Suppose we are interested in constructing a 95% confidence interval for the population proportion of all wildlife workers who reported such skin problems. Use this information for Exercises 65–72.
473
Question 8.242
65. What is the point estimate of , the population proportion of workers reporting skin problems?
8.3.65
Question 8.243
66. Are the conditions met for constructing the desired confidence interval?
Question 8.244
67. What is the critical value ?
8.3.67
Question 8.245
68. Calculate the margin of error . Interpret the margin of error.
Question 8.246
69. Express the confidence interval for in terms of the values for the point estimate ± the margin of error.
8.3.69
Question 8.247
70. Calculate the lower and upper bounds for the confidence interval. Interpret the confidence interval.
Question 8.248
71. How large a sample size would be needed to estimate the population proportion of all wildlife workers who reported such skin problems to within 0.1330 with 95% confidence? Comment on your answer.
8.3.71
54. Same margin of error and same confidence level yields the same sample size.
Question 8.249
72. Suppose we now want the estimate to be within 0.1330 with 99% confidence instead of 95%. Will the required sample size be larger or smaller and why? Verify your statement by finding the required sample size.
Drug Companies and Research Studies. Use this information for Exercises 73–75. The Annals of Internal Medicine reported that 39 of the 40 research studies with acknowledged sponsorship by a drug company had outcomes favoring the drug under investigation.20
Question 8.250
73. If appropriate, construct and interpret a 90% confidence interval for the population proportion of all studies sponsored by drug companies that have outcomes favoring the drug. If not appropriate, clearly state why not.
8.3.73
We have but . Thus we cannot use the interval for .
Question 8.251
74. The article in the Annals of Internal Medicine found that 89 of the 112 studies without acknowledged drug company support had outcomes favoring the drug. If appropriate, construct a 95% confidence interval for the population proportion of all studies without acknowledged drug company support which have outcomes favoring the drug. If not appropriate, clearly state why not.
Question 8.252
75. Refer to Exercise 74. What if we decrease the confidence level to 90%, while changing nothing else? Explain precisely what would happen to the following statistics and why:
- Margin of error
- Width of the confidence interval
8.3.75
(a) Decrease in from 1.96 to 1.645. (b) Decrease in the margin of error from 0.0748 to 0.0628. (c) Decrease in the width of the confidence interval from 0.1496 to 0.1256.
WORKING WITH LARGE DATA SETS
 Chapter 8 Case Study: Motor Vehicle Fuel Efficiency.
Open the Chapter 8 Case Study data set Fuel Efficiency. Here, we will examine confidence intervals for the population proportion of compact cars and the population proportion of midsize cars. We will then see whether these confidence intervals succeeded in capturing their respective population proportions. Use technology to do the following: fueleffciency
Question 8.253
76. Obtain a random sample of size 100 from the data set.
Question 8.254
77. Calculate the sample proportion of vehicles that are compact cars in your sample. Use this as the point estimate of the population of compact cars in the entire population (the entire data set).
8.3.77
Answers will vary.
Question 8.255
78. Confirm that the conditions are met for constructing a 95% confidence interval for the population proportion of compact cars.
Question 8.256
79. Construct a 95% confidence interval for the population proportion of compact cars. Interpret this interval.
8.3.79
Answers will vary.
Question 8.257
80. If we increased our confidence level, describe what would happen to the width of the confidence interval.
Question 8.258
81. Calculate and interpret the margin of error for your confidence interval in Exercise 79.
8.3.81
Answers will vary.
Question 8.259
82. Find the population proportion of compact cars in the entire data set.
Question 8.260
83. Did your confidence interval in Exercise 79 capture the population proportion?
8.3.83
Answers will vary.
Question 8.261
84. Generate a second sample of size 100 from the data set. Construct and interpret a 90% confidence interval for the population proportion of midsize cars, after confirming that the conditions are met. Interpret the interval.
Question 8.262
85. Find the population proportion of midsize cars. Did your confidence interval capture the population proportion?
8.3.85
0.1770. Answers will vary.