STEP-BY-STEP TECHNOLOGY GUIDE: Z Confidence Intervals
We illustrate how to construct the confidence interval for Example 6 (page 436).
TI-83/84
If you have the data values:
- Step 1 Enter the data into list L1 (Figure 10).
- Step 2 Press STAT, highlight TESTS.
- Step 3 Press 7 (for ZInterval).
Step 4 For input (Inpt), highlight Data and press ENTER (Figure 11).
- For σ, enter the assumed value of 6.326.
- For List, press 2nd then L1.
- For Freq, enter 1.
- For C-Level (confidence level), enter the appropriate confidence level (e.g., 0.95), and press ENTER.
- Highlight Calculate and press ENTER. The results are shown in Figure 5 in Example 6.
If you have the summary statistics:
- Step 1 Press STAT, and highlight TESTS.
- Step 2 Press 7 (for ZInterval).
- Step 3 For input (Inpt), highlight Stats and press ENTER (Figure 12).
- For σ, enter the assumed value of 6.326.
- For x̄, enter the sample mean 26.9375.
- For n, enter the sample size 16 .
- For C-Level (confidence level), enter the appropriate confidence level (e.g., 0.95), and press ENTER.
- Highlight Calculate and press ENTER. The results are shown in Figure 5 in Example 6.
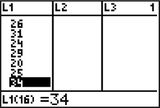 Figure 8.10: FIGURE 10
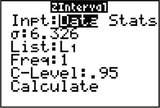 Figure 8.11: FIGURE 11
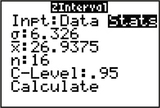 Figure 8.12: FIGURE 12
442
EXCEL
If you have the data values:
- Step 1 Enter the data into Column A.
- Step 2 Label C1 through F1 X-bar, Std Err, X-bar – StdErr, and X-bar + Std Err.
- Step 3 In cell C2, type = AVERAGE (A1: A16) . Press ENTER.
Step 4 Click cell D2, and click the Insert Function icon fx.
Under Search for a function, type confidence.norm. Click Go, and OK.
- Step 5 Enter the Alpha value, 0.05, the known standard deviation (Standard_dev) 6.326, and the sample Size 16 . Click OK.
- Step 6 In cell E2, type =C2−D2, and press ENTER. In cell F2, type =C2+D2, and press ENTER. Cells E2 and F2 are your confidence interval. Results are shown in Figure 13.
If you have the summary statistics:
- Step 1 Label C1 through F1 X-bar, Std Err, X-bar – StdErr, and X-bar + StdErr.
- Step 2 In cell C2, enter the sample average 26.9375.
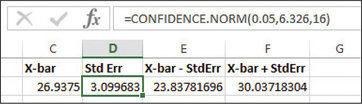 Figure 8.13: FIGURE 13 Excel results.
 - Step 3 Click cell D2, and click the Insert Function icon fx. Under Search for a function, type confidence.norm. Click Go, and OK.
- Step 4 Enter the Alpha value, 0.05, the known standard deviation (Standard_dev) 6.326, and the sample Size 16. Click OK.
- Step 5 In cell E2, type =C2−D2, and press ENTER. In cell F2, type =C2+D2, and press ENTER. Cells E2 and F2 are your confidence interval.
MINITAB
If you have the data values:
- Step 1 Enter the data into column C1.
- Step 2 Click Stat > Basic Statistics > 1-Sample Z…
- Step 3 Select One or more samples, each in a column from the drop-down menu. Click in the empty box below the menu, click C1, then click Select.
- Step 4 Click Options…, enter 95 as the confidence Level, and click OK.
- Step 5 Enter 6.326 for Known standard deviation and click OK.
The results are displayed in Figure 6 in Example 6.
If you have the summary statistics:
- Step 1 Click Stat > Basic Statistics > 1-Sample Z…
- Step 2 Click Summarized Data from the drop-down menu.
- Step 3 Enter the Sample size, 16, and the Sample mean, 26.9375.
- Step 4 Enter 6.326 for the Known standard deviation.
- Step 5 Click Options…, enter 95.0 as the confidence level, click OK, and click OK again.
JMP
If you have the data values:
- Step 1 Click File > New > Data Table. Enter the data into Column 1.
- Step 2 Click Analyze > Distribution. Click Column 1 under Select Columns, then click Y, Columns. Click OK.
- Step 3 Click the red triangle beside Column 1, and click confidence Interval, then Other…
- Step 4 For Enter (1-alpha) for confidence interval, enter 0.95, select Two-sided and click Use known Sigma. Click OK.
- Step 5 For Enter known Sigma, enter 6.326 and click OK. The output is shown in Figure 7.
CRUNCHIT!
If you have the data values:
- Step 1 Click File, then highlight Load from Larose, Discostat3e > Chapter 8, and click on Example 01_06.
- Step 2 Click Statistics > z and select 1-sample.
- Step 3 With the Columns tab chosen, for Sample select Highway MPG. For Standard Deviation, enter 6.326.
- Step 4 Select the confidence Interval tab, and enter 95 for the confidence Interval Level (%). Then click Calculate.
If you have the summary statistics:
- Step 1 Click Statistics > z and select 1-sample.
- Step 2 Choose the Summarized tab. For n, enter the sample size 16; for Sample Mean, enter 26.9375. For Standard Deviation, enter 6.326.
- Step 3 Select the confidence Interval tab, and enter 95 for the confidence Interval Level (%). Then click Calculate.