TO THE STUDENT
Our twenty-first-century world is flooded with data. Stock market returns and sports results snake across our TV screens in a nonstop stream. Grocery purchases are beepbeeped into data warehouses that enable the retailer to analyze the purchases and recommend individualized offers to their customers. Political candidates recite statistical facts and figures, which are often massaged to support their positions on the issues. To develop a deeper sense of meaning and comprehension of data, students today must study statistics: the art and science of collecting, analyzing, presenting, and interpreting data. Discovering Statistics will help you develop the quantitative and analytical tools needed to understand statistics in today's data-saturated world.
The Introductory Statistics Course
Discovering Statistics is intended for an algebra-based, undergraduate, one- or twosemester course in general introductory statistics for non-majors. The only prerequisite is basic algebra. Discovering Statistics will prepare you to work with data in fields such as psychology, business, nursing, education, and liberal arts, to name a few.
The GAISE guidelines, endorsed by the American Statistical Association, include the following recommendations:
- Emphasize statistical literacy and develop statistical thinking.
- Use real data.
- Stress conceptual understanding instead of mere knowledge of procedures.
- Foster active learning in the classroom.
- Use technology for developing conceptual understanding and analyzing data.
- Use assessments to improve and evaluate student learning.
Discovering Statistics adopts these guidelines verbatim as the course pedagogical objectives, with the following single adjustment: (3) Stress conceptual understanding in addition to knowledge of procedures. To these, the text adds two course pedagogical objectives:
- Use case studies to show how newly acquired analytic tools may be applied to a familiar problem.
- Encourage student motivation.
xiv
Approach of Discovering Statistics, Third Edition
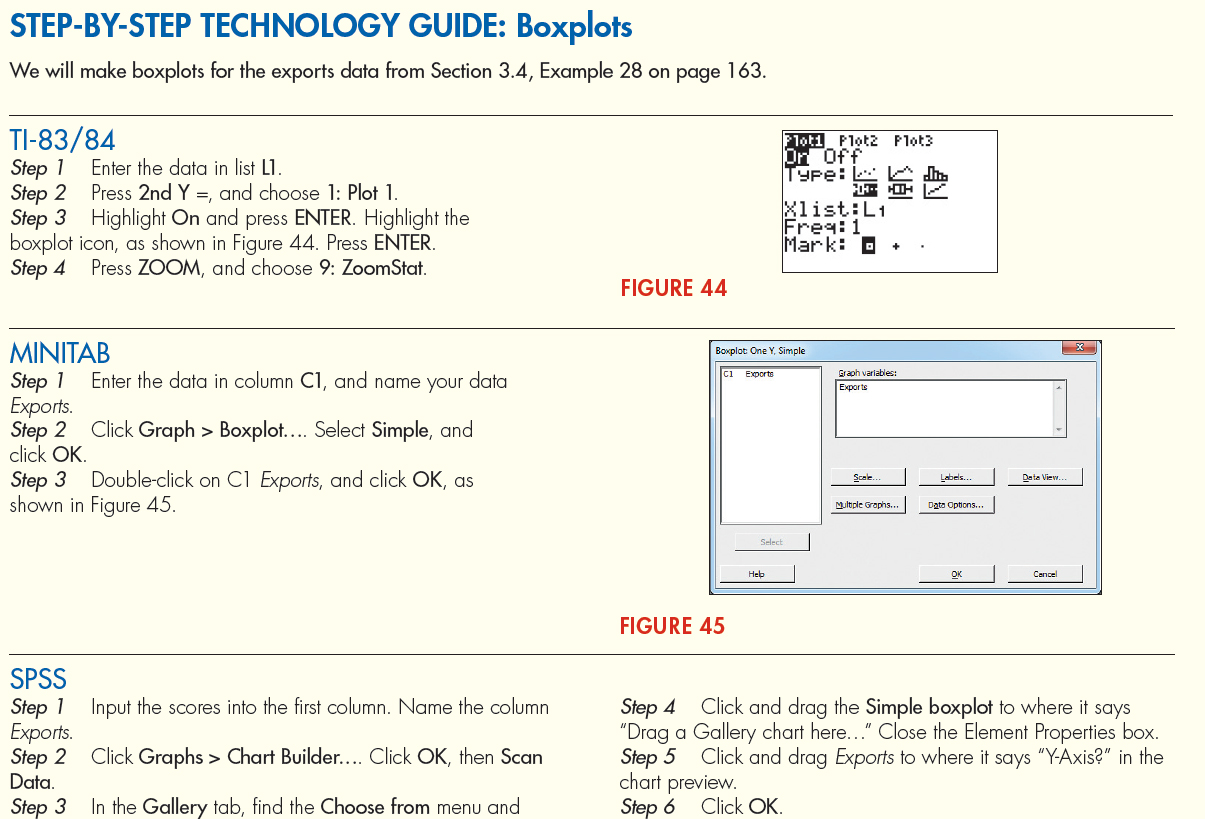
Balanced analytical and computational coverage. The text integrates data interpretation and discovery-based methods with complete computational coverage of introductory statistics topics. Through unique and careful use of pedagogy, the text helps you develop your “statistical sense”—understanding the meaning behind the numbers. Equally, the text includes integrated and comprehensive computational coverage, including step-by-step solutions within examples. Select examples include screenshots and computer output from TI-83/84, Excel, Minitab, SPSS, JMP, and CrunchIt!, with keystroke instructions located in the Step-by-Step Technology Guides at the ends of sections.
Communication of results. Discovering Statistics, Third Edition, emphasizes how, in the real world and in your future careers, you will need to explain statistical results to others who have never taken a statistics course.
Emphasis on variability. The importance of variability in the introductory statistics curriculum cannot be overstated. Without a solid appreciation of how statistics may vary, there is little chance that you will be able to understand the crucial topic of sampling distributions.
Use of powerful, current examples with real data. Video game sales, the use of cell-phone apps, and music videos available for download represent the variety of examples included in Discovering Statistics, Third Edition. Example and exercise topics reflect real-world problems and engage your interest in their solutions. Real data (with sources cited) are frequently used to further demonstrate relevance of topics.
Use of large data sets. The author leverages his expertise as an author and consultant in data mining and predictive analytics to provide the reader, in nearly every chapter, with large data sets to explore and analyze.
New to This Edition
- With extensively revised examples and exercises, the Third Edition provides indepth coverage of topics with increased clarity and comprehensiveness.
- 60% of the examples are new or revised.
- 50% of the exercises are new or revised.
- The number and variety of exercises has been increased, to provide a greater opportunity for different learning styles and practice. Over 4,100 exercises are now included in the book.
- Examples and exercises cover a wide range of applications and use current, real data.
- NEW JMP and SPSS Statistical Software instructions and output screenshots are now included in the Step-by-Step Technology Guides at the end of most sections.
NEW Your Turn
This new feature consists of a small set of exercises after approximately half of the examples. You can use these exercises as a self-test, or instructors can use them in class to further reinforce concepts.
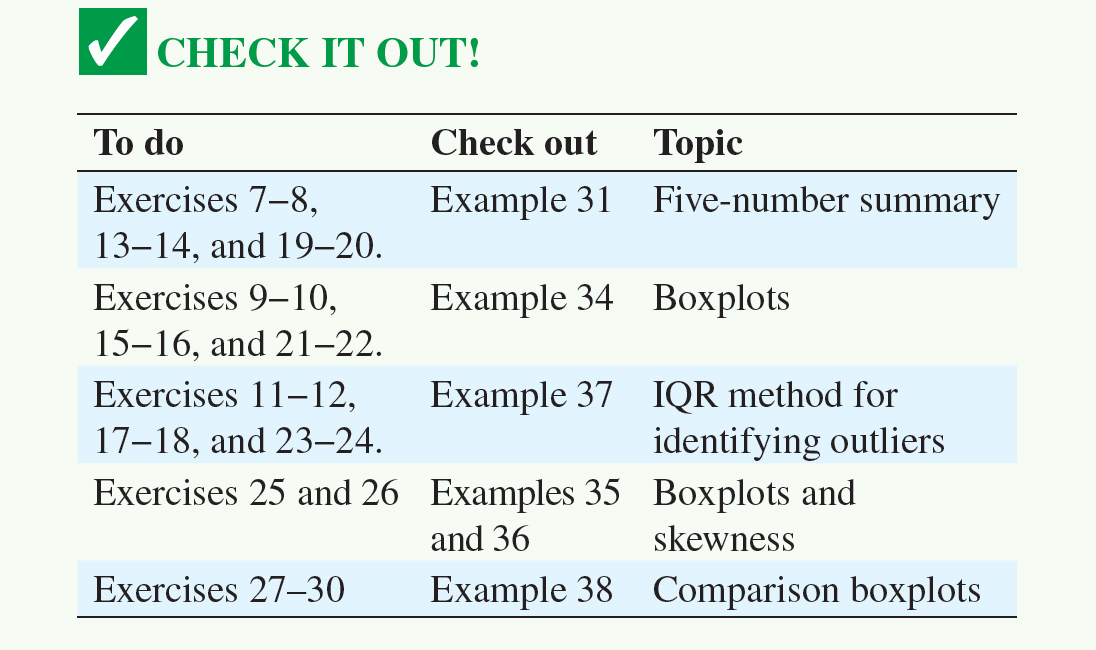
NEW Check It Out
This feature, located at the end of a section, ties the Practicing the Techniques exercises back to specific examples in the chapter, helping you to learn more effectively and engage with the text, and helping instructors more easily organize and assign exercises.
xv
- NEW Each Clarifying the Concepts exercise now provides the page number in the text where the answer may be found. Together with the Check It Out feature, this will assist you in completing your homework more easily.
- NEW Eight brand-new Chapter Case Studies, including
- Chapter 1: Video Game Sales
- Chapter 2: Criminal Justice in New York City
- Chapter 4: Measuring the Human Body
- Chapter 5: The Gardasil Vaccine
- Chapter 6: SAT Scores and AP Exam Scores
- Chapter 8: Motor Vehicle Fuel Efficiency
- Chapter 9: Clothing Store Sales
- Chapter 10: Bank Loans
- Simplified numbering of examples, tables, and figures
- In Chapter 4, examples for computational formulas for the correlation coefficient and the slope of the regression line have been eliminated and moved to the exercises.
- In Chapter 5, the use of contingency tables has been expanded throughout the chapter.
- In Chapter 6, the section on Continuous Random Variables and the Normal Probability Distribution and the section on Standard Normal Distribution have been combined. Also, the topic of Assessing Normality Using Normal Probability Plots has been moved to this chapter.
- In Chapter 7, the section on Introduction to Sampling Distributions and the section on Central Limit Theorem for Means have been combined.
- A new objective has been added in Chapter 9 (Calculate the test statistic ; Find the critical regions and critical values for a hypothesis test).
Features of Discovering Statistics, Third Edition
The Third Edition retains many of the successful features from the Second Edition.

Case Studies. A Case Study begins each chapter and is developed throughout the section examples, using the new set of tools that the section provides. For the Third Edition, coverage of the Case Study in each chapter has been expanded to provide continuity throughout the chapter as you learn new topics and tools.
xvi


xvii
xviii

xix
Exercises. Discovering Statistics, Third Edition, contains a rich and varied collection of section and chapter exercises.
- Clarifying the Concepts (conceptual)
- Practicing the Techniques (skill-based)
- Applying the Concepts (real-world applications)
- Bringing It All Together
These exercises bring together everything you have learned in a particular section, using a related set of Applying the Concepts exercises to tie together the main concepts and techniques learned in the section.
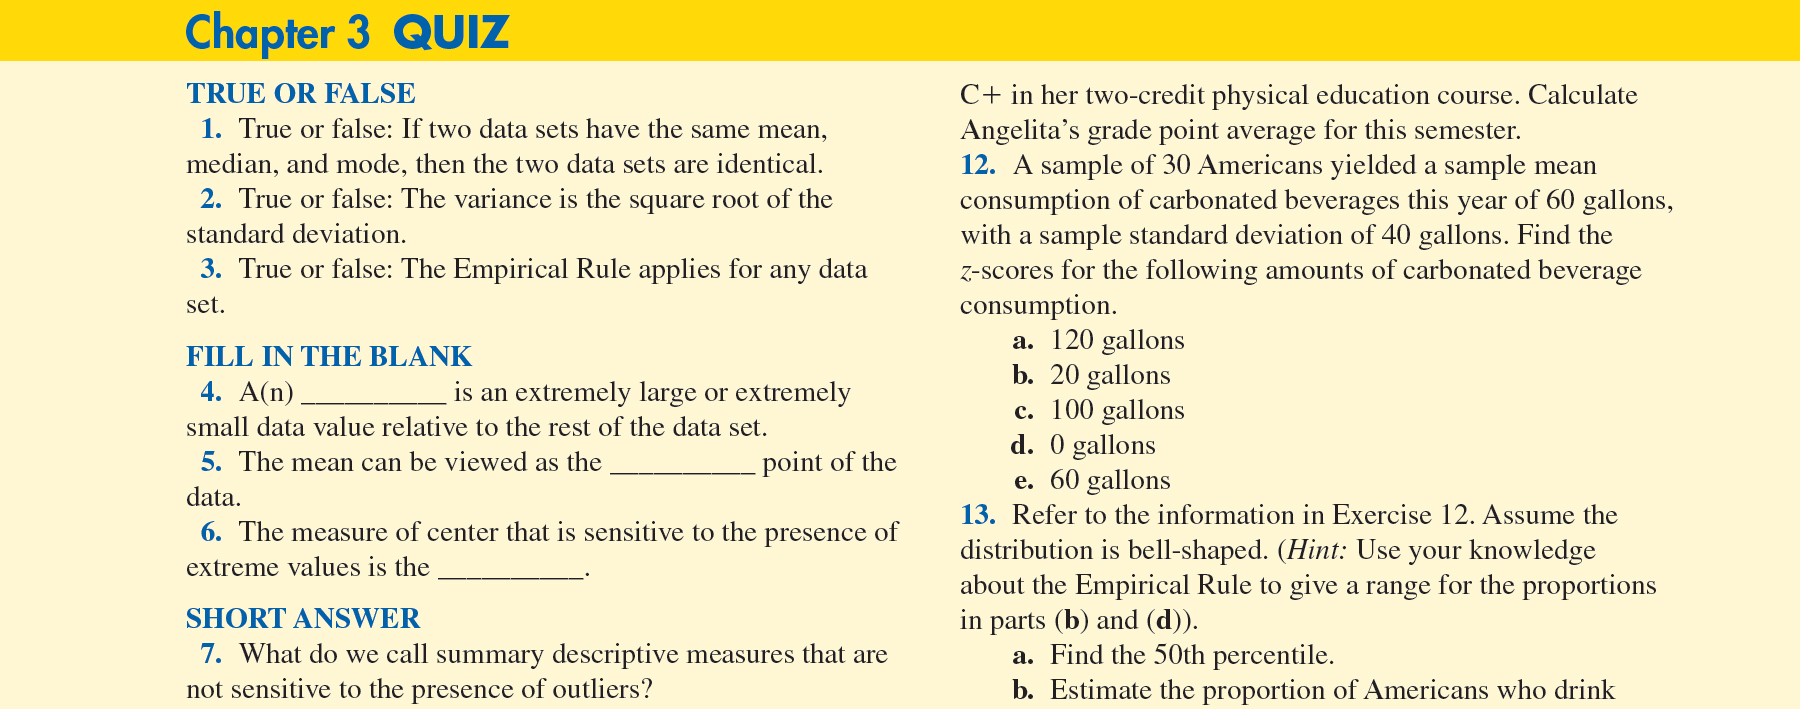
At the end of each chapter, Review Exercises and a Chapter Quiz help to test your overall understanding of each chapter's concepts and to practice for exams (Chapter 3, page 185). The student edition includes answers to odd-numbered exercises and chapter quiz exercises in the back of the book.
![]() Applets. Applet icons in the text help to mark chapter material and exercises for which interactive statistical applets are available.
Applets. Applet icons in the text help to mark chapter material and exercises for which interactive statistical applets are available.
 Caution notes. Signaled by the Caution icon, these warnings in the text help you avoid common errors and misconceptions.
xx
Media and Supplements
The following electronic and print supplements are available with Discovering Statistics, Third Edition:
 W. H. Freeman's new online homework system, LaunchPad, offers our quality content curated and organized for easy assignability in a simple yet powerful interface. We have taken what we have learned from thousands of instructors and hundreds of thousands of students to create a new generation of W. H. Freeman/Macmillan technology.
Curated units. Combining a curated collection of videos, homework sets, tutorials, applets, and e-Book content, LaunchPad's interactive units give instructors a building block to use as is or as a starting point for customized learning units. A majority of exercises from the text can be assigned as online homework, including an abundance of algorithmic exercises. An entire unit's worth of work can be assigned in seconds, drastically reducing the amount of time it takes for instructors to have their course up and running.
Easily customizable. Instructors can customize the LaunchPad units by adding quizzes and other activities from our vast wealth of resources. They can also add a discussion board, a drop box, and an RSS feed, with a few clicks. LaunchPad allows instructors to customize students' experiences as much or as little as desired.
Useful analytics. The gradebook quickly and easily allows instructors to look up performance metrics for classes, individual students, and individual assignments.
Intuitive interface and design. The student experience is simplified. Students' navigation options and expectations are clearly laid out at all times, ensuring they can never get lost in the system.
Assets integrated into LaunchPad include the following:
Interactive e-Book. Every LaunchPad e-Book comes with powerful study tools for students, video and multimedia content, and easy customization for instructors. Students can search, highlight, and bookmark, making it easier to study and access key content. Teachers can ensure that their classes get just the book they want to deliver by customizing and rearranging chapters, adding and sharing notes and discussions, and linking to quizzes, activities, and other resources.
 LearningCurve provides students and instructors with powerful adaptive quizzing, a game-like format, direct links to the e-Book, and instant feedback. The quizzing system features questions tailored specifically to the text and adapts to students' responses, providing material at different difficulty levels and topics based on student performance.
 SolutionMaster offers an easy-to-use, Web-based version of the instructor's solutions, allowing instructors to generate a solution file for any set of homework exercises.
Statistical Video Series consists of StatClips, StatClips Examples, and Statistically Speaking “Snapshots.” View animated lecture videos, whiteboard lessons, and documentary-style footage that illustrate key statistical concepts and help students visualize statistics in real-world scenarios.
New Video Technology Manuals available for TI-83/84 calculators, Minitab, Excel, JMP, SPSS, R, Rcmdr, and CrunchIt! provide brief instructions for using specific statistical software.
Updated StatTutor Tutorials offer multimedia tutorials that explore important concepts and procedures in a presentation that combines video, audio, and interactive features. The newly revised format includes built-in, assignable assessments and a bright new interface.
xxi
Updated Statistical Applets give students hands-on opportunities to familiarize themselves with important statistical concepts and procedures, in an interactive setting that allows them to manipulate variables and see the results graphically. Icons in the textbook indicate when an applet is available for the material being covered.
 CrunchIt! is W. H. Freeman's Web-based statistical software that allows users to perform all the statistical operations and graphing needed for an introductory statistics course and more. It saves users time by automatically loading data from Discovering Statistics, and it provides the flexibility to edit and import additional data.
 JMP Student Edition (developed by SAS) is easy to learn and contains all the capabilities required for introductory statistics. JMP is the leading commercial data analysis software of choice for scientists, engineers, and analysts at companies throughout the world (for Windows and Mac). Register inside LaunchPad at no additional cost.
Stats@Work Simulations put students in the role of the statistical consultant, helping them better understand statistics interactively within the context of real-life scenarios.
EESEE Case Studies (Electronic Encyclopedia of Statistical Examples and Exercises), developed by The Ohio State University Statistics Department, teach students to apply their statistical skills by exploring actual case studies using real data.
Data files are available in CrunchIt!, JMP, ASCII, Excel, TI, Minitab, SPSS (an IBM Company)*, R, and CSV formats.
Student Solutions Manual provides solutions to the odd-numbered exercises in the text.
Instructor's Guide with Full Solutions includes teaching suggestions, chapter comments, and detailed solutions to all exercises, and is available electronically within LaunchPad.
Test Bank offers hundreds of multiple-choice questions and is available in LaunchPad.
Lecture Slides offer a customizable, detailed lecture presentation of statistical concepts covered in each chapter of Discovering Statistics, Third Edition.
Additional Resources Available with Discovering Statistics, Third Edition
Web site www.macmillanhighered.com/discostat3e. This open-access Web site includes data files and Chapter 14, “Nonparametric Statistics.”
Special Software Packages. Student versions of JMP and Minitab are available for packaging with the printed text. JMP is also available inside LaunchPad at no additional cost.
 i-clicker is a two-way radio-frequency classroom response solution developed by educators for educators. Each step of i-clicker's development has been informed by teaching and learning.
* SPSS was acquired by IBM in October 2009.
xxii