Section 9.5 Exercises
CLARIFYING THE CONCEPTS
Question 9.267
1. What is the difference between and ? (p. 543)
9.5.1
is the sample proportion andis population proportion.
Question 9.268
2. What are the conditions for the test for ? (p. 545)
Question 9.269
3. Explain the essential idea about hypothesis testing for the proportion. (p. 543)
9.5.3
Answers will vary.
Question 9.270
4. Explain what refers to. (p. 543)
Question 9.271
5. What possible values can take? (p. 543)
9.5.5
Between 0 and 1 inclusive:
Question 9.272
6. What is the difference between and a -value? (p. 546)
553
PRACTICING THE TECHNIQUES
 CHECK IT OUT!
| To do | Check out | Topic |
|---|---|---|
| Exercises 7–14 | Example 25 | Calculating for the test for proportion |
| Exercises 15–18 | Example 26 |
test for using the critical-value method |
| Exercises 19–22 | Example 27 |
test for using the -value method |
| Exercises 23–26 | Example 29 | Using a confidence interval for to perform two-tailed hypothesis tests about |
| Exercises 27–30 | Example 30 | Interpreting software output |
For Exercises 7–9, find the value of the test statistic for a right-tailed test with .
Question 9.273
7. A sample of size 50 yields 30 successes.
9.5.7
2.8868
Question 9.274
8. A sample of size 50 yields 40 successes.
Question 9.275
9. A sample of size 50 yields 45 successes.
9.5.9
7.2169
Question 9.276
10. What kind of pattern do we observe in the value of for a right-tailed test as the number of successes becomes more extreme?
For Exercises 11–13, find the value of the test statistic for a two-tailed test with .
Question 9.277
11. A sample of size 80 yields 20 successes.
9.5.11
–4.47
Question 9.278
12. A sample of size 80 yields 30 successes.
Question 9.279
13. A sample of size 80 yields 40 successes.
9.5.13
0
Question 9.280
14. What kind of pattern do we observe in the value of as the sample proportion approaches ?
For Exercises 15–18, do the following:
- Check the normality conditions.
- State the hypotheses.
- Find and the rejection rule.
- Calculate .
- Compare with . State the conclusion and the interpretation.
Question 9.281
15. Test whether the population proportion is less than 0.5. A random sample of size 225 yields 100 successes. Let level of significance .
9.5.15
(a) We have and , so we can use thetest for proportions. (b) (c) . Reject if . (d) −1.67 (e) Since , we reject . There is evidence that the population proportion is less than 0.5.
Question 9.282
16. Test whether the population proportion differs from 0.3. A random sample of size 100 yields 25 successes. Let level of significance .
Question 9.283
17. Test whether the population proportion exceeds 0.6. A random sample of size 400 yields 260 successes. Let level of significance .
9.5.17
(a) We have and , so we can use thetest for proportions. (b) (c) . Reject if . (d) 2.04 (e) Since , we reject . There is evidence that the population proportion is greater than 0.6.
Question 9.284
18. Test whether differs from 0.4. A random sample of size 900 yields 400 successes. Let level of significance .
For Exercises 19–22, do the following:
- Check the normality conditions.
- State the hypotheses and the rejection rule for the -value method, using level of significance .
- Find .
- Find the -value.
- Compare the -value with level of significance . State the conclusion and the interpretation.
Question 9.285
19. Test whether the population proportion exceeds 0.4. A random sample of size 100 yields 44 successes.
9.5.19
(a) We have and , so we can use the test for proportions. (b) . Reject if the (c) 0.82 (d) (e) Since the is not , we do not reject . There is insufficient evidence that the population proportion is greater than 0.4.
Question 9.286
20. Test whether the population proportion is less than 0.2. A random sample of size 400 yields 75 successes.
Question 9.287
21. Test whether the population proportion differs from 0.5. A random sample of size 900 yields 475 successes.
9.5.21
(a) We have and , so we may use the test for proportions. (b) Reject if the . (c) 1.67 (d) (e) Since the is not , we do not reject . There is insufficient evidence that the population proportion is not equal to 0.5.
Question 9.288
22. Test whether the population proportion exceeds 0.9. A random sample of size 1000 yields 925 successes.
For Exercises 23–26, a confidence interval for is given. Use the confidence interval to test, using level of significance , whether differs from each of the indicated hypothesized values.
Question 9.289
23. A 95% confidence interval for is (0.1, 0.9). Hypothesized values are
- 0
- 1
- 0.5
9.5.23
| Value of | Form of hypothesis test, with | Where lies in relation to 95% confidence interval (0.1, 0.9) | Conclusion of hypothesis test | |
|---|---|---|---|---|
| (a) | 0 | Outside | Reject | |
| (b) | 1 | Outside | Reject | |
| (c) | 0.5 | Inside | Do not reject |
Question 9.290
24. A 99% confidence interval for is (0.51, 0.52). Hypothesized values are
- 0.511
- 0.521
- 0.519
Question 9.291
25. A 90% confidence interval for is (0.1, 0.2). Hypothesized values are
- 0.09
- 0.9
- 0.19
9.5.25
| Value of | Form of hypothesis test, with | Where lies in relation to 90% confidence interval (0.1, 0.2) | Conclusion of hypothesis test | |
|---|---|---|---|---|
| (a) | 0.09 | Inside | Reject | |
| (b) | 0.9 | Outside | Reject | |
| (c) | 0.19 | Inside | Do not reject |
Question 9.292
26. A 95% confidence interval for is (0.05, 0.95). Hypothesized values are
- 0.01
- 0.5
- 0.06
For Exercises 27–30, software output from a test for is provided. For each, examine the indicated software output, and provide the following steps:
- Step 1 State the hypotheses and the rejection rule.
- Step 2 Find .
- Step 3 Find the -value.
- Step 4 State the conclusion and the interpretation.
Use level of significance for each hypothesis test.
Question 9.293
27. TI-83/84 output
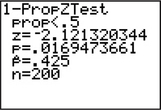
9.5.27
Step 1
We reject if the .
Step 2
Step 3
Step 4 The is , so we reject . There is evidence at level of significance that the population proportion is less than 0.5.
554
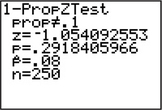
Question 9.294
28. TI-83/84 output
Question 9.295
29. Minitab output
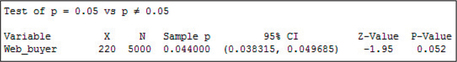
9.5.29
Step 1
We reject if the .
Step 2
Step 3
Step 4 The is not , so we do not reject . There is insufficient evidence at level of significance that the population proportion is not equal to 0.05.
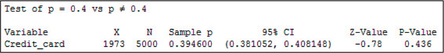
Question 9.296
30. Minitab output
APPLYING THE CONCEPTS
Question 9.297
31. Facebook Not Cool Anymore? In 2014, Facebook
reported that 23% of its users were ages 18–24, a decrease from the 2011 level of 30.9%. (Though this is partly due to more older people joining Facebook, there was nevertheless a loss of over 3 million users in this age group.) A survey of 500 randomly selected Facebook users showed that 100 of them were ages 18–24. If appropriate, test, using level of significance , whether the population proportion of Facebook users who are ages 18–24 has decreased from 23%.
9.5.31
Both and , so the conditions for using the test for proportions are met.
Step 1
We reject if the .
Step 2
Step 3
Step 4 The is , so we reject . There is evidence at level of significance that the population proportion of Facebook users ages 18–24 has decreased from 23%.
Question 9.298
32. Twenty-Somethings. According to the U.S. Census Bureau, 7.1% of Americans living in 2004 were between the ages of 20 and 24. Suppose that a random sample of 400 Americans taken this year yields 35 between the ages of 20 and 24. If appropriate, test whether the population proportion of Americans ages 20–24 is different from 7.1%. Use level of significance .
Question 9.299
33. Nonmedical Pain Reliever use. The National Survey on Drug Use and Health reported that 4.8% of persons ages 12 or older used a prescription pain reliever nonmedically.14 Suppose that a random sample of 900 persons ages 12 or older found 54 who had used a prescription pain reliever nonmedically. If appropriate, test whether the population proportion has increased, using level of significance .
9.5.33
Both and , so the conditions for using the test for proportions are met.
Step 1
We reject if the .
Step 2
Step 3
Step 4 The is not , so we do not reject . There is insufficient evidence at level of significance that the population proportion of persons ages 12 or older who used a prescription pain reliever nonmedically has increased from 4.8%.
Question 9.300
34. Is This a Date, or What? In 2014, USA Today reported that 57% of 18- to 24-year-olds agreed that texting has made it more difficult to determine whether an outing is an actual date or not. Suppose that a recent random sample of 1000 18- to 24-year-olds found 500 who agreed with that sentiment. Test whether the population proportion of 18- to 24-year-olds who agree that texting has made it more difficult to determine whether an outing is an actual date has decreased, using level of significance .
Question 9.301
35. Mutual Fund Performance. Business Insider reported that 58% of mutual funds underperformed in 2013, against the Standard and Poor 500 benchmark. Suppose a random sample of 100 mutual funds showed 67 that had underperformed. Test whether the population proportion has increased, using level of significance .
9.5.35
Both and , so the conditions for using the test for proportions are met.
Step 1
We reject if the .
Step 2
Step 3
Step 4 The is , so we reject . There is evidence at level of significance that the population proportion of mutual funds that underperform has increased from 58%.
Question 9.302
36. Affective Disorders Among Women. What do you think is the most common nonobstetric (not related to pregnancy) reason for hospitalization among 18- to 44-year-old American women? According to the U.S. Agency for Healthcare Research and Quality (www.ahrq.gov), this is the category of affective disorders, such as depression. In 2002, of hospitalizations among 18- to 44-year-old American women, 7% were for affective disorders. Suppose that a random sample taken this year of 1000 hospitalizations of 18- to 44-year-old women showed 80 admitted for affective disorders. We are interested in whether the population proportion of hospitalizations for affective disorders has changed since 2002. Test, using level of significance .
Question 9.303
37. Latino Household Income. The U.S. Census Bureau reported that 15.3% of Latino families had household incomes of at least $75,000. We are interested in whether the population proportion has changed, using the critical-value method and level of significance . Suppose that a random sample of 100 Latino families reported 23 with household incomes of at least $75,000.
- Is it appropriate to perform the test for the proportion? Why or why not?
- Perform the appropriate hypothesis test.
9.5.37
(a) Yes. We have and . (b) Reject if . . . Since the is not , we do not reject . There is insufficient evidence that the population proportion of Hispanic families that had a household income of at least $75,000 is not equal to 0.153.
Question 9.304
38. Massively Online Dropouts? TechCrunch.com reported in 2014 that the completion rate for massively open online courses (MOOCs) is only 6.5%. Suppose a new study of 1000 randomly chosen students taking a MOOC found that 75 completed the course. Test, using level of significance , whether the population proportion of students completing MOOCs has increased.
Question 9.305
39. Living with the Parents. The National Association of Home Builders reported that 57% of young people ages 18–24 were living with their parents. Suppose a sample of 100 young people ages 18–24 showed 60 who were living with their parents. Test, using level of significance , whether the population proportion has changed.
9.5.39
Both and , so the conditions for using the test for proportions are met.
Step 1 We reject if the .
Step 2
Step 3
Step 4 The is not , so we do not reject . There is insufficient evidence at level of significance that the population proportion of young people ages 18–24 who are living with their parents differs from 57%.
Question 9.306
40. Living with the Parents. Refer to Exercise 39.
- Evaluate the strength of evidence against the null hypothesis.
- Suppose that we decide to perform the same test as Exercise 39, however, this time using a different method. (If you used the critical-value method earlier, use the -value method, and vice-versa.) Without actually performing the test, what would the conclusion be and why?
- Would a 95% interval for contain ? Explain.
BRINGING IT ALL TOGETHER
Children and Environmental Tobacco Smoke at Home. Use the following information for Exercises 41–44. The Environmental Protection Agency reported that 11% of children age 6 and under were exposed to environmental tobacco smoke (ETS) at home on a regular basis (at least four times per week).15 A random sample of 100 children age 6 and under showed that 6% of these children had been exposed to ETS at home on a regular basis.
555
Question 9.307
41. Answer the following:
- Is it appropriate to perform the test for the proportion? Why or why not?
- Test at level of significance whether the population proportion of children age 6 and under exposed to ETS at home on a regular basis has decreased.
9.5.41
(a) We have and , so we can use thetest for proportions. (b) . Reject if . . Since is not , we do not reject . There is insufficient evidence that the population proportion of children age 6 and under exposed to ETS at home on a regular basis is less than 0.11.
Question 9.308
42. Refer to Exercise 41.
- Which is the only possible error you can be making here, a Type I or a Type II error? What are some consequences of this error?
- Suppose that a newspaper headline reported “Second-hand Smoke Prevalence Down.” How would you respond? Does your inference support this headline?
Question 9.309
43. Refer to your work in Exercise 41.
- Test at level of significance whether the population proportion of children age 6 and under exposed to ETS at home on a regular basis has decreased.
- How do you explain the different conclusions you got in the two hypothesis tests above?
- Evaluate the strength of evidence against the null hypothesis.
9.5.43
(a) Since the , we reject . There is evidence that the population proportion of children age 6 and under exposed to environmental tobacco smoke at home on a regular basis is less than 0.11. (b) The difference is because we changed the value of and not because we used different methods for the two different hypothesis tests. (c) Since , there is mild evidence against the null hypothesis that the population proportion of children age 6 and under exposed to environmental tobacco smoke at home on a regular basis is greater than or equal to 0.11.
Question 9.310
 44. Refer to Exercise 41. What if the sample proportion decreased, but everything else stayed the same? Describe what would happen to the following, and why.
- The -value
- The conclusion
Car Accidents Among Young Drivers. Use the following information for Exercises 45–47. The National Transportation Safety Board publishes statistics on the number of automobile crashes that people in various age groups have. Young people ages 18–24 have an accident rate of 12%, meaning that on average 12 out of every 100 young drivers per year had an accident. A researcher claims that the population proportion of young drivers having accidents is greater than 12%. Her study examined 1000 young drivers ages 19–24 and found that 134 had an accident this year.
Question 9.311
45. Perform the appropriate hypothesis test with level of significance .
9.5.45
Both and , so the conditions for using the test for proportions are met.
Step 1 We reject if the .
Step 2
Step 3
Step 4 The is not , so we do not reject . There is insufficient evidence at level of significance that the population proportion of young people ages 18–24 who have had an accident has increased from 12%.
Question 9.312
46. What if our sample size and the number of successes are doubled, so that remains the same? Otherwise, everything else is the same. Describe how this change would affect the following.
- The -value
- The conclusion
Question 9.313
47. What if the hypothesized proportion was no longer 0.12? Instead, takes some value between 0.12 and 0.134. Otherwise, everything else is the same as in the original example. Describe how this change would affect the following.
- The -value
- The conclusion
9.5.47
(a) Increases. (b) Decreases (c) Increases (d) Stays the same (e) Stays the same
WORKING WITH LARGE DATA SETS
Fast Food versus Full Service Restaurants. Open the data set, Restaurants. Here, we will look at the fast food restaurants, but in a different way. We will explore the proportion of counties that have no fast food restaurants at all. Use technology to do the following:
Question 9.314
restaurants
48. Obtain a random sample of size 100 from the data set.
Question 9.315
restaurants
49. Find the sample proportion of counties with zero fast food restaurants.
Question 9.316
restaurants
50. Using your sample, test whether the population proportion of counties with no fast food restaurants is less than 0.10, using level of significance .
Question 9.317
restaurants
51. Find the actual value of the population proportion of counties with no fast food restaurants. Did your hypothesis test in Exercise 50 make the right decision? Explain.
WORKING WITH LARGE DATA SETS
 Chapter 9 Case Study: Clothing Store Sales. Open the Chapter 9 Case Study data set, Clothing Store. Here, we will compare the proportions of buyers of blouses and buyers of suits. Use technology to do the following:
Question 9.318
clothingstore
52. Obtain a random sample of size 100 from the data set.
Question 9.319
clothingstore
53. Find the sample proportion of customers who have bought a blouse (value = 1 for variable = blouse).
Question 9.320
clothingstore
54. Find the sample proportion of customers who have bought a suit (value = 1 for variable = suit).
Question 9.321
clothingstore
55. Using your sample, test whether the population proportion of customers who have bought a blouse exceeds 0.5, using level of significance .
Question 9.322
clothingstore
56. Explain why we need not perform a hypothesis test to determine whether the population proportion of customers who have bought a suit exceeds 0.5.
Question 9.323
clothingstore
57. Using your sample, test whether the population proportion of customers who have bought a suit exceeds 0.1, using level of significance .