REGION
5.1
LEARNING OBJECTIVE
Describe how ethnic groups are distributed geographically, and discuss how and why these distributions have changed over time.
Formal ethnic culture regions exist in most countries (see Figure 5.5). Ethnic and racialized minority populations tend to cluster in particular spatial patterns. These tend to shift over time in response to changes in policies, attitudes, and the changing cultural boundaries of racial and ethnic difference.
ETHNIC HOMELANDS AND ISLANDS
There are four types of ethnic culture regions: the rural ethnic homelands and islands, and urban ethnic neighborhoods and ghettos. The difference between ethnic homelands and islands is their size, in terms of both area and population. Rural ethnic homelands cover large areas, often have overlapping municipal borders, and include sizable populations. Because of their size, the age of their inhabitants, and their geographical segregation, they tend to reinforce ethnic identities. The residents of homelands typically seek or enjoy some measure of political autonomy or self-rule. Homeland populations usually exhibit a strong sense of attachment to the region. Most homelands belong to indigenous ethnic groups and include special, venerated places that serve to symbolize and celebrate the region—shrines to the special identity of the ethnic group. In its fully developed form, the homeland represents that most powerful of geographical entities, one combining the attributes of both formal and functional culture regions. By contrast, ethnic islands are small dots in the countryside, usually occupying an area smaller than a county and serving as home to several hundred to several thousand people (at most). Because of their small size and isolation, they do not exert as powerful an influence as homelands do.
ethnic homelands
Sizable areas inhabited by an ethnic minority that exhibits a strong sense of attachment to the region and often exercises some measure of political and social control over it.
ethnic islands
Small ethnic areas in the rural countryside; sometimes called folk islands.
185
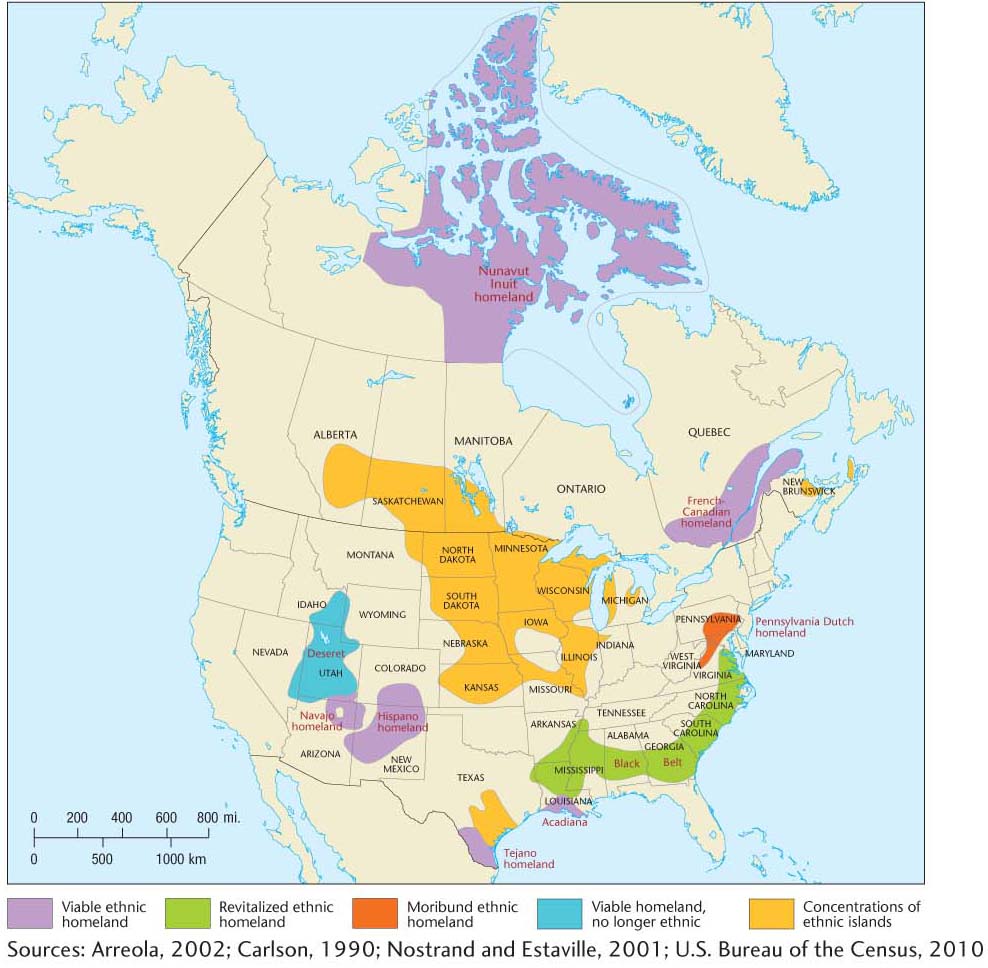
North America includes a number of viable ethnic homelands (Figure 5.6), including Acadiana, the Louisiana French homeland now increasingly identified with the Cajun people and also recognized as a vernacular region; the Hispano or Spanish American homeland of highland New Mexico and Colorado; the Tejano homeland of south Texas; the Navajo reservation homeland in Arizona, Utah, and New Mexico; and the French Canadian homeland centered on the valley of the lower St. Lawrence River in Québec. Some geographers include Deseret, a Mormon homeland in the Great Basin of the intermontane West. Some ethnic homelands have experienced decline and decay. These include the Pennsylvania Dutch homeland, which has been weakened to the point of extinction by assimilation. Other homelands, notably the southern Black Belt, was once moribund, having been diminished by the collapse of the plantation-sharecrop system and the resulting African American relocation to northern urban areas. But, it has experienced a revitalization through the recent return migration of African Americans to the South. Nonethnic immigration has diluted the Hispano homeland. At present, the most vigorous ethnic homelands are those of the French Canadians and Mexican Americans in south Texas.
186
187
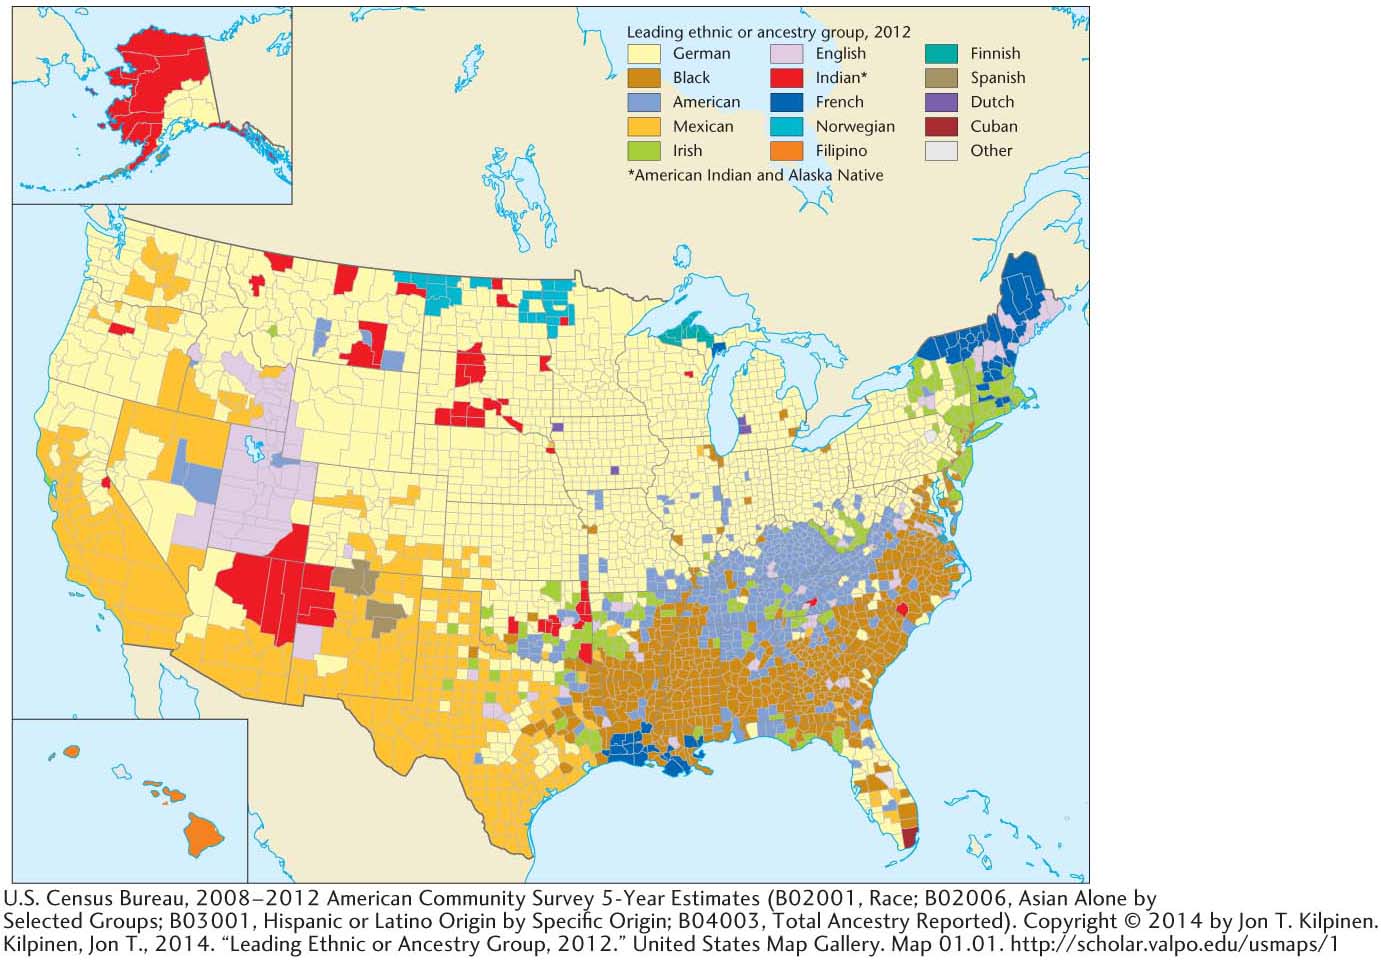
If residents of ethnic homelands assimilate and are absorbed into the host culture, then at the very least, a geographical residue, or ethnic substrate, remains. The resulting culture region, though no longer ethnic, nevertheless retains some distinctiveness, whether in local cuisine, dialect, or traditions. Thus, it differs from surrounding regions in a variety of ways. In seeking to explain its distinctiveness, geographers often discover an ancient, vanished ethnicity. For example, the Italian province of Tuscany owes both its name and some of its uniqueness to the Etruscan people, who ceased to be an ethnic group 2000 years ago, when they were absorbed into the Latin-speaking Roman Empire. More recently, the massive German presence in the American heartland (Figure 5.7), now largely nonethnic, helped shape the cultural character of the Midwest, which can be said to have a German ethnic substrate.
ethnic substrate
Regional cultural distinctiveness that remains following the assimilation of an ethnic homeland.
ETHNIC NEIGHBORHOODS AND RACIALIZED GHETTOS
Formal ethnic culture regions also occur in cities throughout the world, as minority populations initially create, or are consigned to, separate ethnic residential quarters. Two types of urban ethnic culture regions exist. An ethnic neighborhood is a voluntary community where people of common ethnicity reside by choice. An ethnic neighborhood has many benefits: common use of a language other than that of the majority culture, nearby kin, stores and services specially tailored to a certain group’s tastes, the presence of employment that relies on an ethnically based division of labor, and institutions important to the group—such as churches and lodges—that remain viable only when a number of people live close enough to participate frequently in their activities. Miami’s orthodox Jewish population clusters in Miami Beach-area neighborhoods (Figure 5.8) in part because the proximity of synagogues and kosher food establishments makes religious observance far easier than it would be in a neighborhood that did not have a sizable orthodox Jewish population.
ethnic neighborhood
A voluntary community where people of like origin reside by choice.

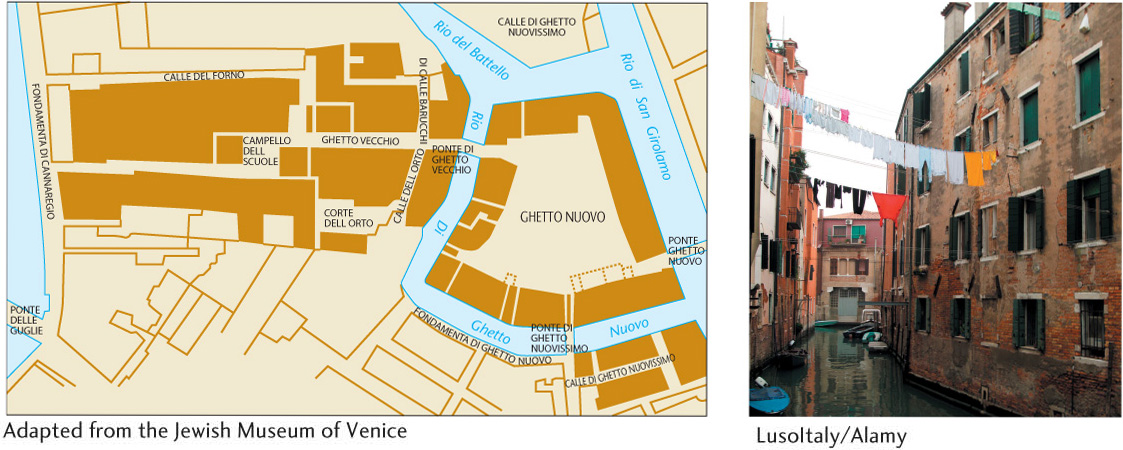
The second type of urban ethnic region is a ghetto. Historically, the term dates from thirteenth-century medieval Europe, when Jews lived in segregated, walled communities called ghettos (Figure 5.9). Ethnic residential quarters have, in fact, long been a part of urban cultural geography. In ancient times, conquerors often forced the vanquished native population to live in ghettos. Religious minorities usually received similar treatment. Islamic cities, for example, had Christian districts. If one abides by the origin of the term, ghettos need be neither composed of racialized minorities nor impoverished. Typically, however, the term ghetto is commonly used in the United States today to signal an impoverished, urban, African American neighborhood. A related term, barrio, refers to an impoverished, urban, Hispanic neighborhood. Ghettos and barrios are as much functional culture regions as formal ones.
ghetto
Traditionally, an area within a city where an ethnic group lives, either by choice or by force. Today in the United States, the term typically indicates an impoverished African American urban neighborhood.
188
Coinciding with the urbanization and industrialization of North America, ethnic neighborhoods became typical in the northern United States and in Canada about 1840. Instead of dispersing throughout the residential areas of the city, immigrant groups clustered together in a spatial expression of diaspora cultures, discussed in Chapter 2. To some degree, ethnic groups that migrated to cities came from different parts of Europe than those who settled in rural areas. Whereas Germany and Scandinavia supplied most of the rural settlers, the cities attracted those from Ireland and eastern and southern Europe. Catholic Irish, Italians, and Poles, along with Jews from eastern Europe, became the main urban ethnic groups, although lesser numbers of virtually every nationality in Europe also came to the cities of North America. These groups were later joined by French Canadians, southern blacks, Puerto Ricans, Appalachian whites, Native Americans, Asians, and other non-European groups.
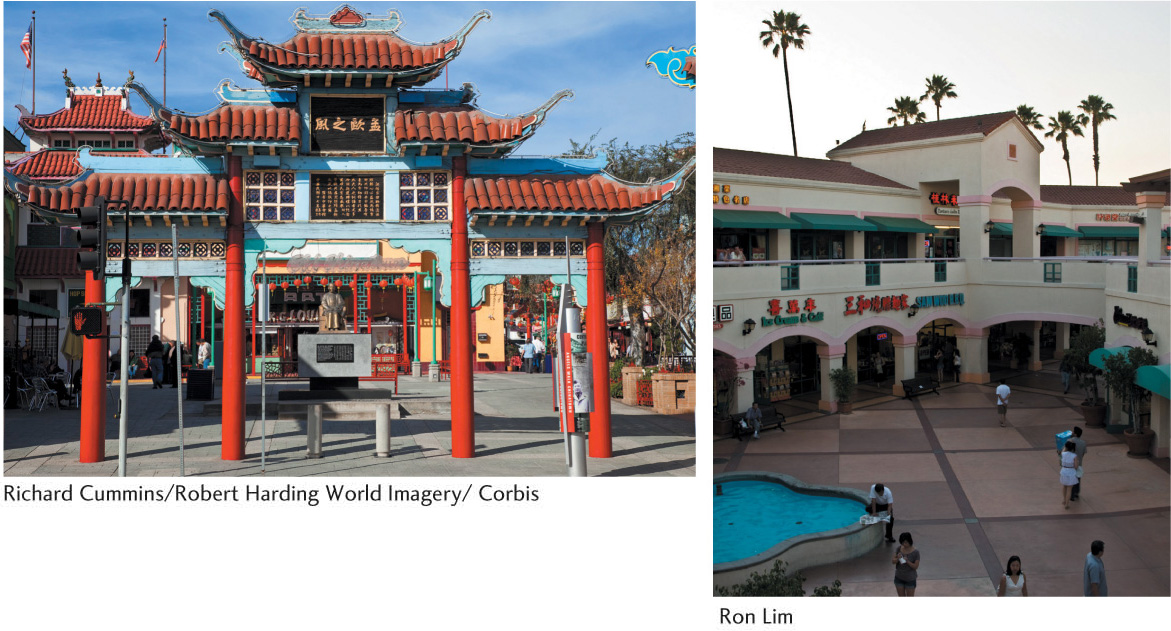
Regardless of their particular history, the neighborhoods created by ethnic migrants tend to be transitory. As a rule, urban ethnic groups remain in neighborhoods while “learning the ropes” as sociologists Alejandro Portes and Rubén Rumbaut put it. As a result, their central-city ethnic neighborhoods experience a life cycle in which one group is replaced by another, later-arriving one. We can see this process in action in the succession of groups that resided in certain neighborhoods and then moved on to more desirable areas. The list of groups that passed through one Chicago neighborhood from the nineteenth century to the present provides an almost complete history of American migratory patterns. First came the Germans and Irish, who were succeeded by the Greeks, Poles, French Canadians, Czechs, and Russian Jews, who were soon replaced by the Italians. The Italians, in turn, were replaced by Chicanos and a small group of Puerto Ricans. As this succession occurred, the established groups had often attained enough economic and cultural capital to move to new areas of the city. In many cities, established ethnic groups moved to the suburbs. Even when ethnic groups relocated from inner-city neighborhoods to the suburbs, ethnic residential clustering survived (Figure 5.10). The San Gabriel Valley, about 20 miles (32 kilometers) from downtown Los Angeles, has developed as a major Chinese suburb. These suburban ethnic neighborhoods, called ethnoburbs, can house relatively affluent populations.
ethnoburbs
A suburban ethnic neighborhood, sometimes home to relatively affluent immigration populations.
189
RECENT SHIFTS IN ETHNIC MOSAICS
In the United States, immigration laws have changed during the past half century, shifting in 1965 from the quota system based on national origins to one that allowed a certain number of immigrants from the Eastern and Western hemispheres, as well as giving preference to certain categories of migrants, such as family members of those already residing in the United States. These changes, and the rising levels of undocumented immigration, have led to a growing ethnic variety in North American cities.
190
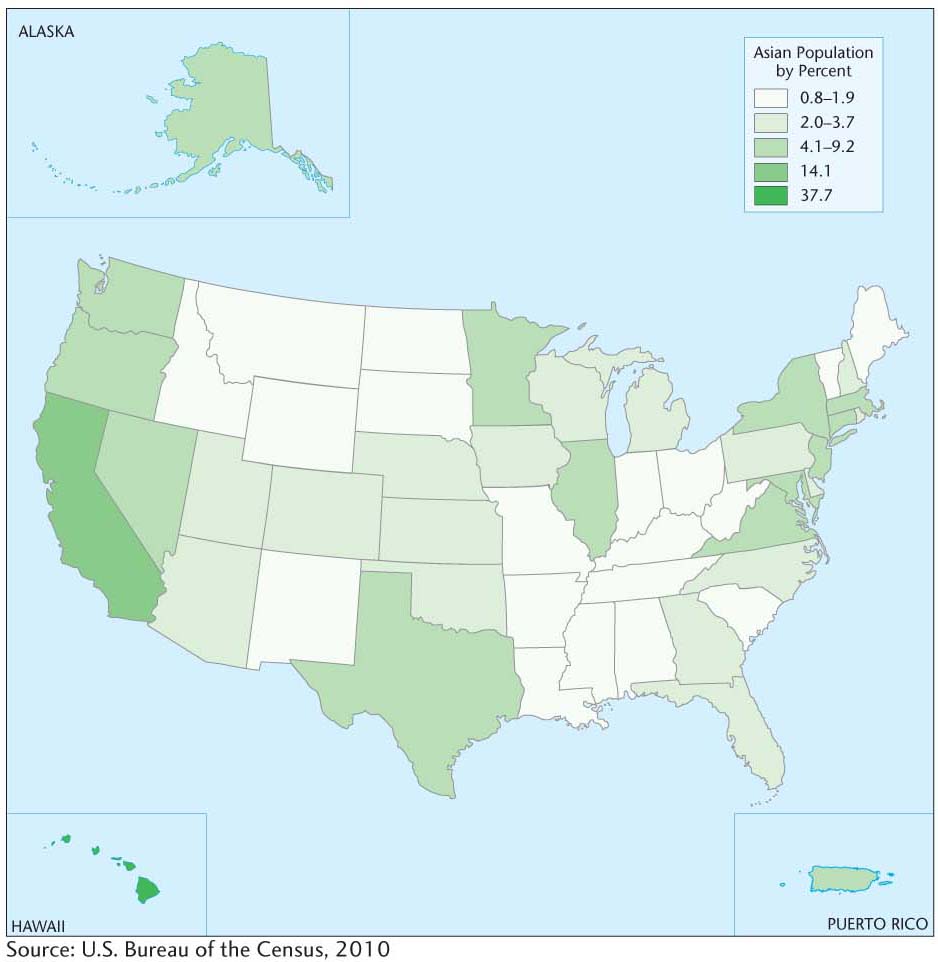
Asia and Latin America, rather than Europe, are now the principal source of immigrants to North America. In 2010 Mexico alone supplied 23.7 percent of immigrants to the United States; China, the Philippines, India, and Vietnam were next, with a combined total of 15.9 percent. Asian and Pacific Islanders are now the fastest-growing group in the United States, projected to grow from only 5.6 percent of the U.S. population today to 10 percent by 2050. People of Japanese ancestry form the largest national-origin group in Hawaii, and many West Coast cities, from Vancouver to San Diego, have very sizable Asian populations. Vancouver, already 11 percent Asian in 1981, has since absorbed many more Asian immigrants, particularly from Hong Kong, which again became part of China in 1997.
191
Canadian statistical data show that, in 2012, Chinese were by far the largest non-European ethnic group in Vancouver, accounting for l out of every 5 Vancouverites. In the United States, the West Coast is home to about 40 percent of the Asian population, mostly in California, whereas the urban corridor that stretches from New York City to Boston houses another concentration (Figure 5.11). Spatially speaking, Asians are less segregated than African American or Hispanic populations.
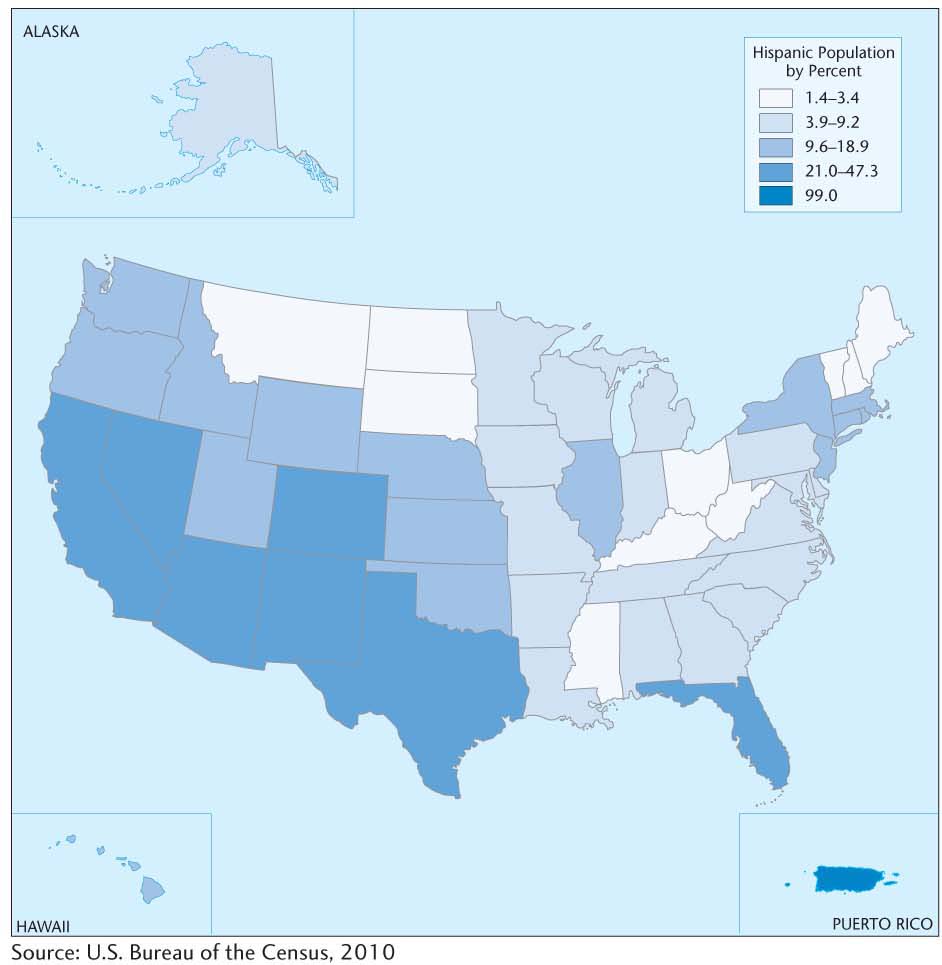
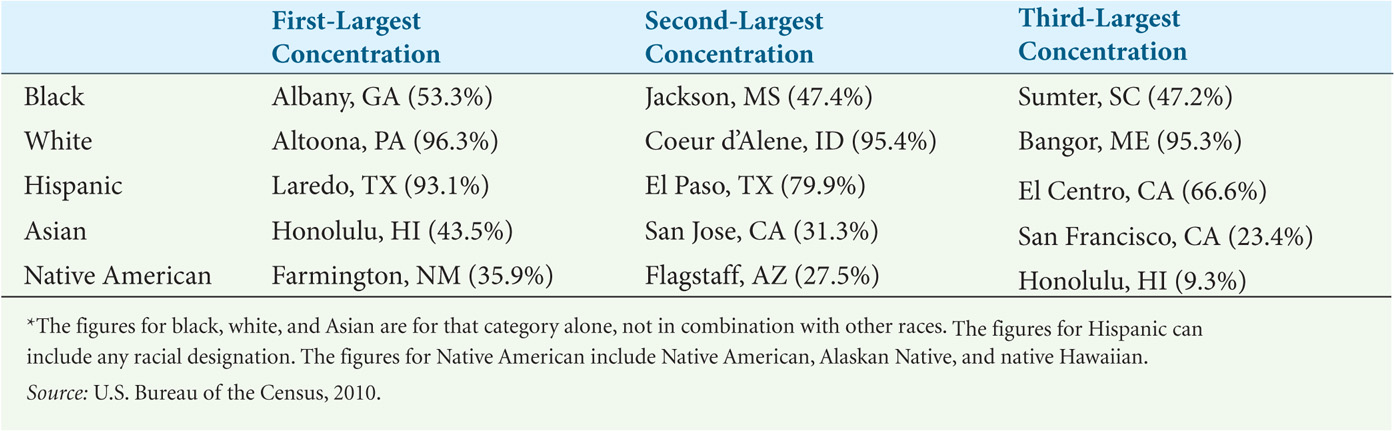
Latin America, including the Caribbean countries, has also surpassed Europe as a source of immigrants to North America (Figure 5.12). The two largest national-origin groups of Hispanic immigrants—Mexicans and Cubans—are still the most prevalent, but they have been supplemented since the 1980s by waves of Central American and, increasingly, South American arrivals. East Coast cities have absorbed large numbers of immigrants from the West Indies. The two largest national-origin groups coming to New York City as early as the 1970s were from the Dominican Republic and Jamaica, displacing Italy as the leading source of immigrants. For the United States as a whole, in 2002, Latinos surpassed African Americans as the largest ethnic group, after non-Hispanic whites. In some cities that are popular destinations for Hispanic immigrants, Hispanics constitute majority populations (Table 5.1). The Latino influx into the United States has rewoven significant portions of the cultural mosaic, influencing food preferences, music, fashion, and language.
192
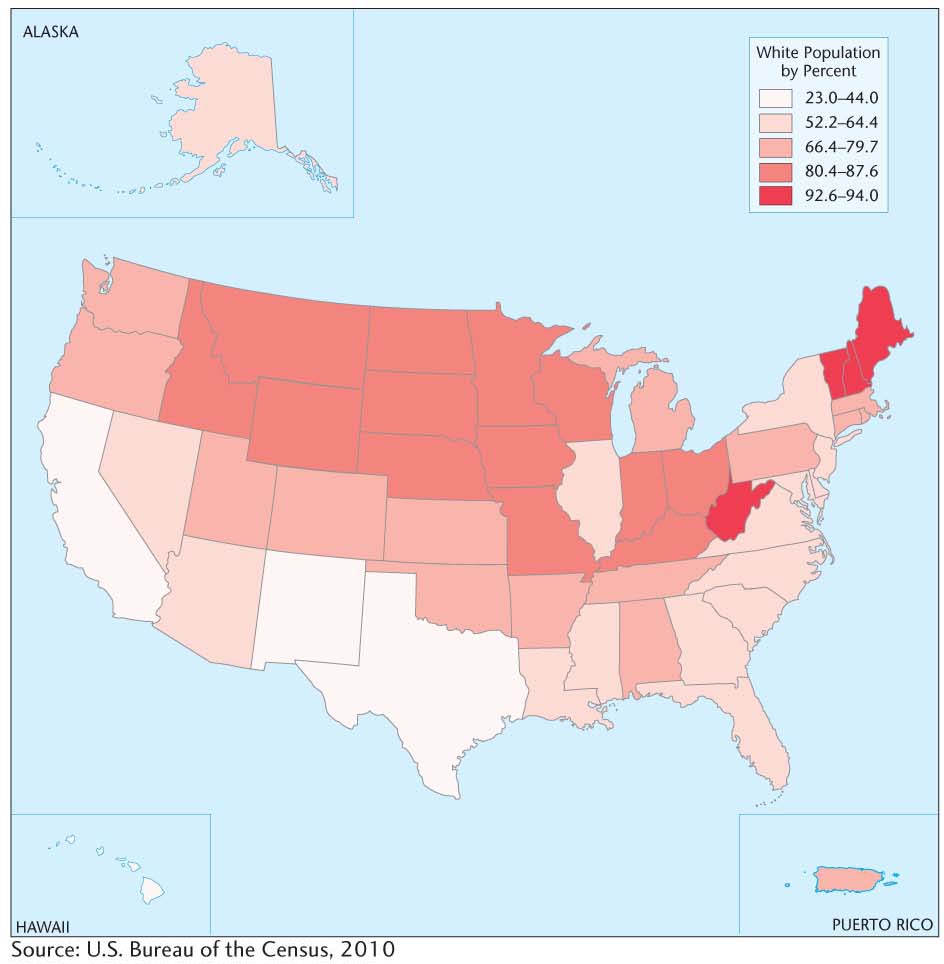
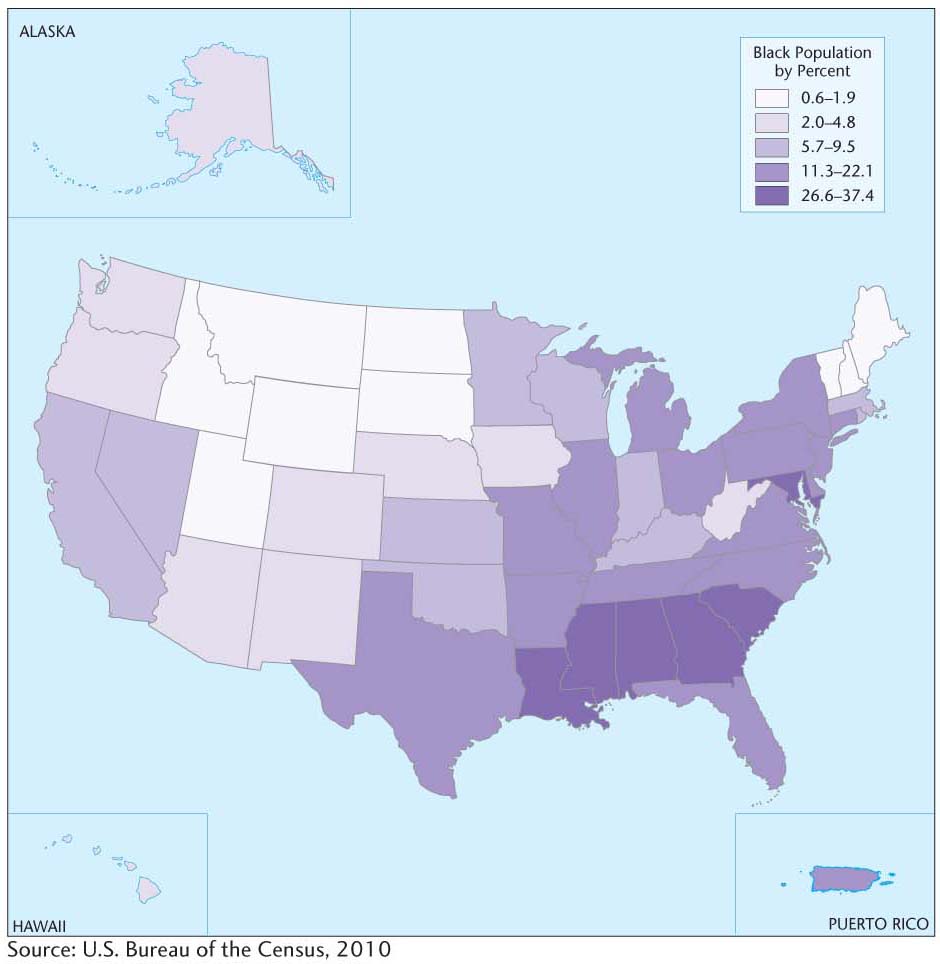
As demographer William Frey has noted, ethnic populations continue to concentrate in established ports of entry, most of them in coastal locations. There is a large swath of the United States that has remained largely non-Hispanic white (Figure 5.13). Figure 5.14 shows that black Americans, too, remain spatially concentrated (see also Figure 2.20 in Chapter 2 for a map of Native American and Alaska Native population distribution). The 2010 census reported that 79 percent of whites live in white-majority neighborhoods, while 44 percent of African Americans live in black-majority neighborhoods and 45 percent of Hispanics reside in Hispanic-majority neighborhoods. As a nation, we may be becoming more diverse—a more colorful mosaic—but we are nowhere near the melting pot we sometimes portray ourselves to be.
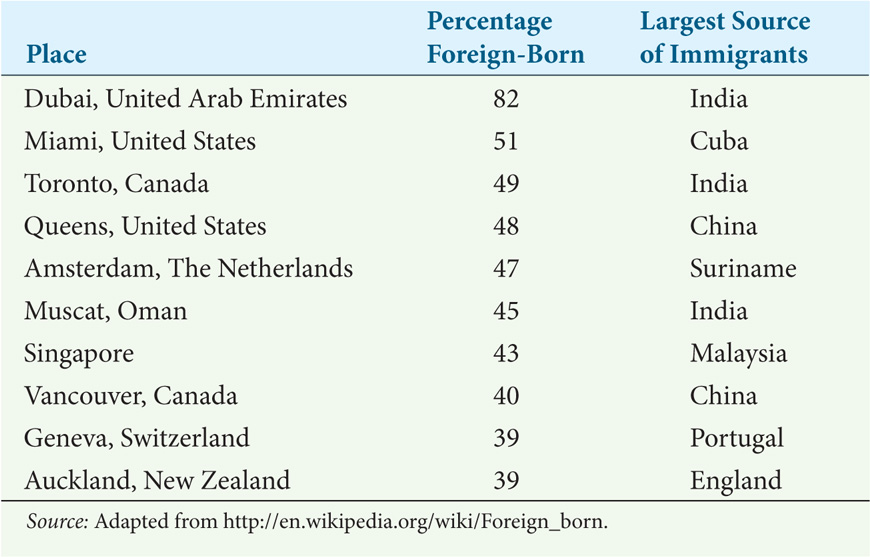
The United States is home to more foreign-born people—40 million as of the 2010 U.S. Census—than any other country, and these individuals represent 12.9 percent of the country’s population. Yet, although the United States may boast of its immigrant background, other countries are home to higher percentages of the foreign-born. Nineteen percent of Canada’s population is foreign-born, as is 38 percent of Israel's. Some of the world’s small city-states have even higher percentages of foreign-born populations, with Singapore at 43 percent and the United Arab Emirates at 71 percent foreign-born. Only two U.S.cities—Miami, Florida, and Queens, New York— ranked in the top 10 list of the world’s places that have significant proportions of foreign-born residents (Table 5.2). Two of the top 10 places are located in the Middle East, two in Europe, two in Canada, and one each in Asia and the Pacific. In addition, national-origin populations prevalent in the United States are even more prevalent in other countries. Fifty million ethnic Chinese reside outside China and Taiwan. Most of these overseas Chinese live not in North America but in Southeast Asian countries. Thailand counts more than 9 million, Indonesia has nearly that number, and Malaysia more than 7 million. Parts of East Africa have long been home to relatively affluent South Asian Indian populations, whereas Lebanese populations in West Africa enjoy a similarly privileged position. Even European countries such as Germany, the United Kingdom, Italy, and Spain—long known as sources rather than destinations of migrants—today are home to millions of Africans, Turks, and Asians. Immigration-based ethnicity is far from being a phenomenon limited to North America (see Subject to Debate).
193
194
195