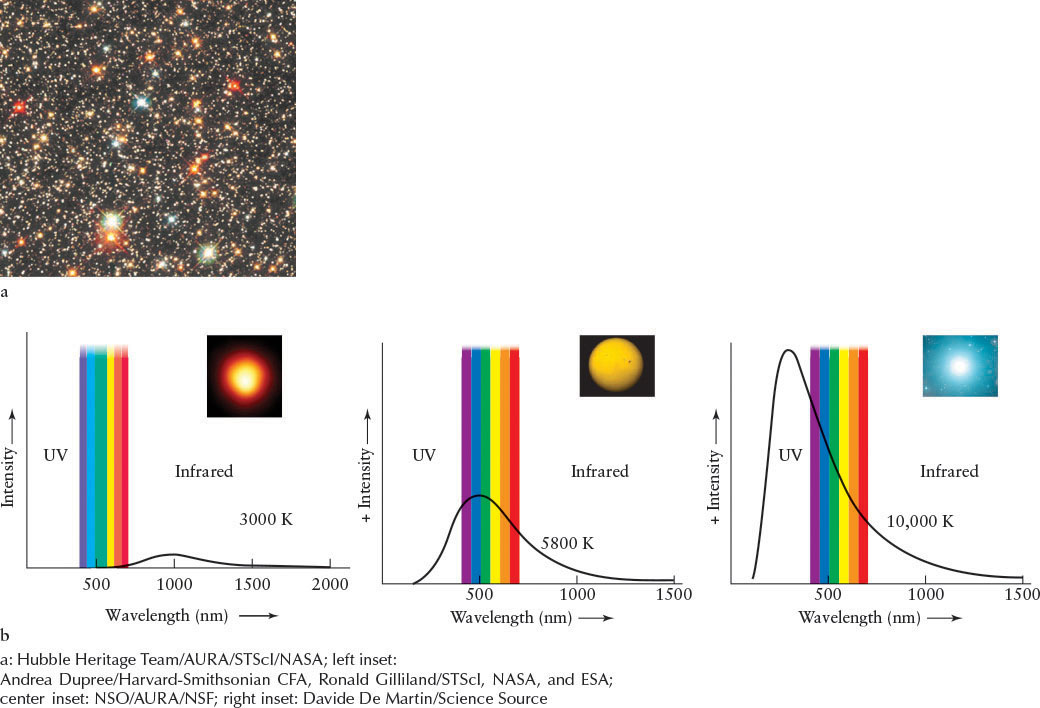
Figure 11-4 RIVUXG Temperature and Color (a) This beautiful Hubble Space Telescope image shows the variety of colors of stars. (b) These diagrams show the relationship between the color of a star and its surface temperature. The intensity of light emitted by three stars is plotted against wavelength (compare with Figure 4-2). The range of visible wavelengths is indicated. The location of the peak of a each star’s intensity curve, relative to the visiblelight band, determines the apparent color of its visible light. The insets show stars of about these surface temperatures. Ultraviolet (UV) extends to 10 nm. See Figure 3-6 for more on wavelengths of the spectrum.