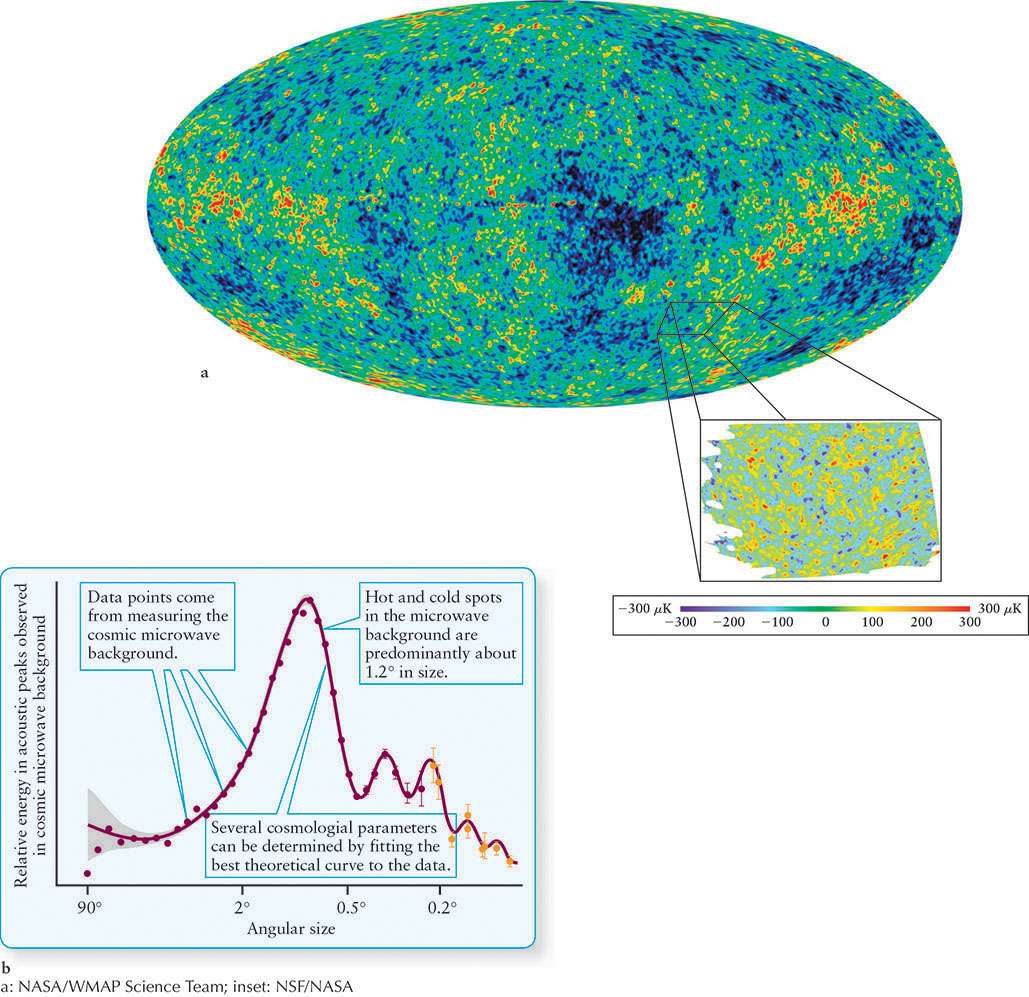
Figure 18-15 RIVUXG Structure of the Early Universe (a) This microwave map of the entire sky, produced from data taken by the Wilkinson Microwave Anisotropy Probe (WMAP), shows temperature variations in the cosmic microwave background. Red regions are about 0.00003 K warmer than the average temperature of 2.73 K; blue regions are about 0.00003 K cooler than the average. Inset: These tiny temperature fluctuations, observed by BOOMERANG, are related to the large-scale structure of the universe today, indicating where superclusters and voids grew. The radiation detected to make this map is from a time 380,000 years after the Big Bang. (b) Acoustic peaks show the sizes of the hot spots on the inset map in (a), along with overtones that provide information about the kinds of matter in the universe.