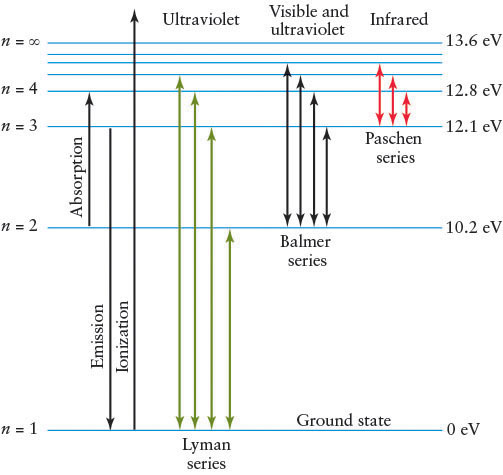
Figure 4-11 Energy Level Diagram of Hydrogen The activity of a hydrogen atom’s electron is conveniently displayed in a diagram showing some of the energy levels, labeled n, at which the electron can exist. A variety of electron jumps, or transitions, are also shown, including those that produce the most prominent lines in the hydrogen spectrum.