The Temperatures of Stars
Margin Question 11-3
Question
Why can the total energy output of a star be specified equally by its absolute magnitude and its luminosity?
Armed with knowledge of stellar luminosities, astronomers early in the twentieth century searched for ways to use this information to determine why stars shine. A major step in this process was to find a graph on which physically similar stars are located near each other, because such groupings often provide insight into how objects work. Astronomers found this graph when they plotted either the luminosity or, equivalently, the absolute magnitude versus the stars’ surface temperatures. The resulting graph led to our models of both stellar activity and stellar evolution. To find the surface temperatures, we start with a fact that is easily overlooked: Stars are not all the same color.
11-4 A star’s color reveals its surface temperature
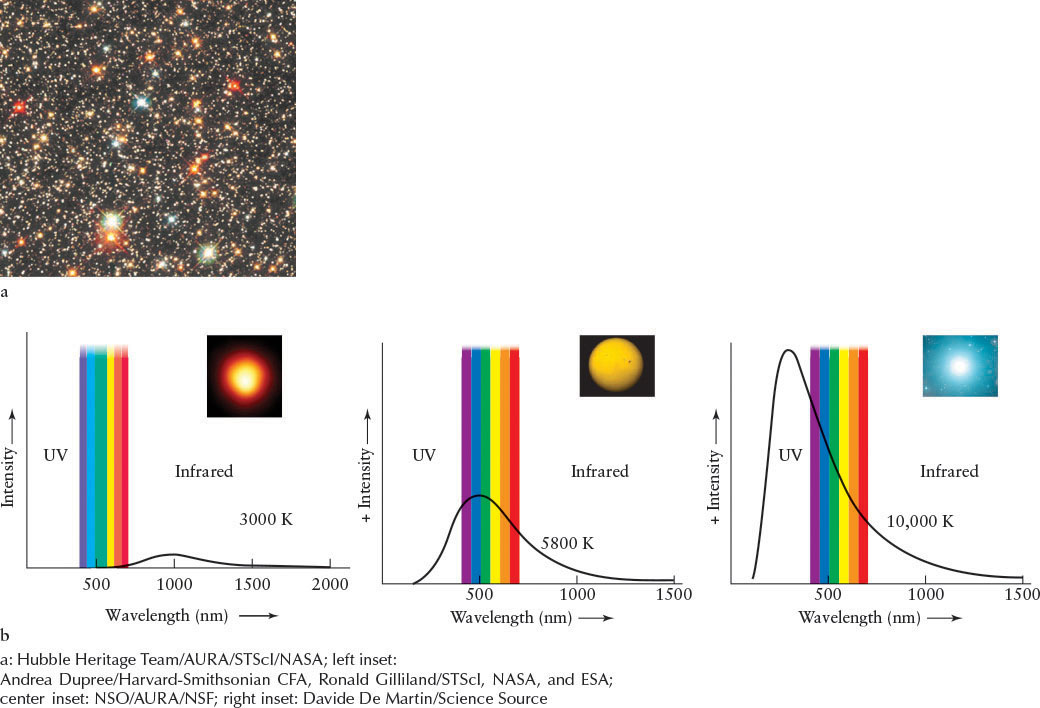
 Viewing stars with your naked eyes, it is often hard to see that they have different colors, because the color-sensitive cone cells in our eyes are not stimulated very much by such dim objects. Through binoculars or a telescope, their colors, most commonly red, orange, yellow, white, and blue-white, become apparent (see the figure that opens this chapter, Figure 11-2, and (Figure 11-4a). Like the Sun, stars are very nearly blackbodies. Therefore, their colors are determined by their surface temperatures. Recall from Figure 4-2 that different blackbody curves are associated with blackbodies of different temperatures. These curves differ in both their intensities and the locations of their peaks, as described by Wien’s law (see Section 4-2).
350
Margin Question 11-4
Question
A star of which temperature has the most intense blue radiation: 3000 K, 5200 K, or 6800 K?
Three typical blackbody curves are presented in Figure 11-4b. The intensity of light from a relatively cool star peaks at long wavelengths, so the star looks red. The intensity of light from a very hot star peaks at shorter wavelengths, making it look blue. The maximum intensity of a star of intermediate temperature, such as the Sun, is found near the middle of the visible spectrum.
To accurately determine the peaks of stars’ blackbody spectra and, hence, their surface temperatures, astronomers need to know which blackbody curve most accurately describes each star. Photometry provides this information. In this process, a telescope collects starlight that is then passed through one of a set of colored filters and recorded on a CCD. At least three photometric images are taken of each star through filters that pass different wavelengths of light. The intensity of a star’s image is different at different wavelengths. By plotting the three data points and finding which unique blackbody curve they fit on, we can determine that star’s surface temperature.
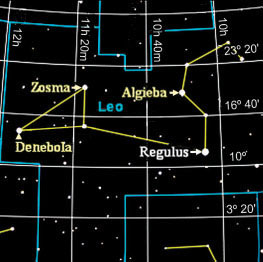
If a star’s surface is very hot, perhaps 10,000 K (see the hottest star in Figure 11-4b), its radiation is skewed toward the ultraviolet, which makes the star bright as detected through an ultraviolet-passing filter, dimmer through a blue filter, and dimmer still through a yellow filter. Regulus, in Leo, is such a star. If a star is cool, say, 3000 K (see the coolest star in Figure 11-4b), its radiation peaks at long visible or even infrared wavelengths, making the star bright through a red filter, dimmer through a yellow filter, and dimmer still through a blue filter. Betelgeuse (Figure 11-2a) and Aldebaran are examples of such cool stars. Humans are blackbody radiators with peak temperatures around 300 K. Our peak is in the infrared.
11-5 A star’s spectrum also reveals its surface temperature
Another way to determine a star’s surface temperature is from a study of its spectrum, a technique called stellar spectroscopy (see Chapter 4). Recall that spectral lines result from the absorption and scattering of starlight by gases in the star’s atmosphere, in interstellar space, and in Earth’s atmosphere. Astronomers begin by taking the spectrum of a star and then identifying and discarding spectral lines due to interstellar gas and Earth’s atmosphere. What remain are spectral lines created in the star’s atmosphere. These lines provide us with knowledge of the chemical compositions of the outer layers of stars.
351
At first glance, there seems to be a bewildering variety of stellar spectra, some of which are shown in Figure 11-5. Some stellar spectra show prominent absorption lines of hydrogen. Others exhibit many absorption lines of calcium and iron. Still others are dominated by broad absorption lines created by molecules, such as titanium oxide.
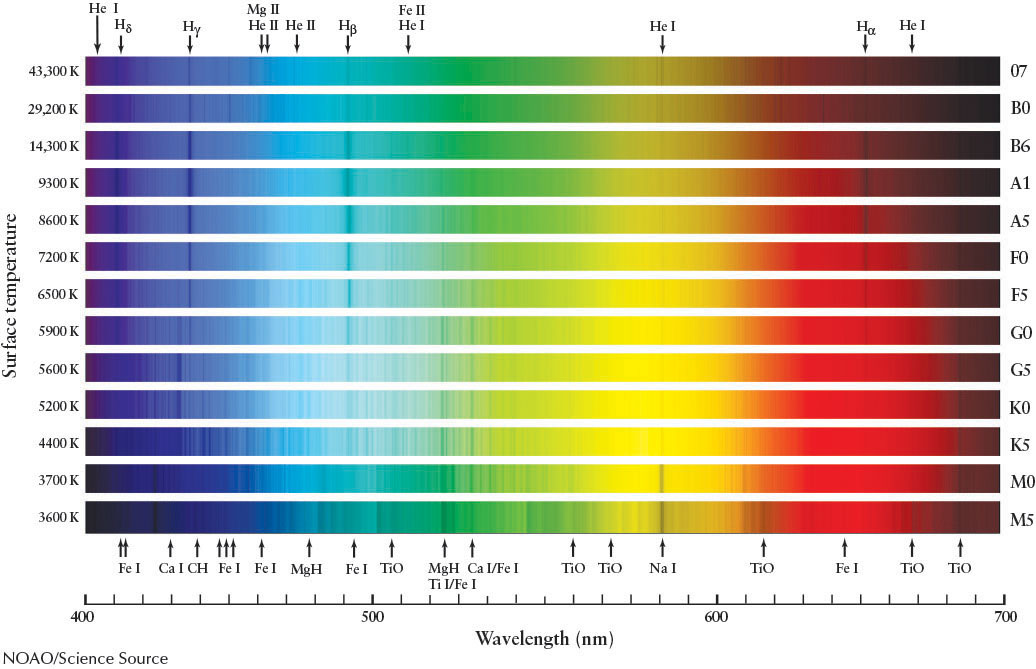
Fortunately, these spectra all hold clues about the nature of stars and, in particular, their surface temperatures. Consider the abundant hydrogen gas found in nearly every star’s atmosphere. Although hydrogen accounts for about three-quarters of the mass of a typical star, strong (meaning dark) hydrogen absorption lines do not show up in every star’s spectrum. The strength of the absorption lines depends on the star’s temperature. In the late 1920s, astronomer Cecilia Payne-Gaposchkin (1900–1979) and physicist Meghnad Saha (1893–1956) succeeded in explaining why a star’s visible hydrogen spectrum is affected by its surface temperature.
Niels Bohr’s model of the hydrogen atom (recall Figure 4-12) shows why. As Bohr proposed in the early 1900s, the visible hydrogen lines, called Balmer lines, are produced when photons excite electrons initially in the second, n = 2, energy level of hydrogen to a higher energy level. Recall from Section 4-6 that these are labeled Hα, Hβ, Hγ, and so on. At 10,000 K, most hydrogen electrons absorb enough energy from photons to normally reside in the n = 2 level. When these electrons gain further energy, they move to higher energy levels. Therefore, a star with that surface temperature produces the strongest Balmer lines.
Why do hotter or cooler stars produce weaker (less dark) Balmer absorption lines? Suppose first that the star is much hotter than 10,000 K. High-energy photons that stream through the photosphere completely strip away (ionize) electrons from most of the hydrogen atoms there. Because an ionized hydrogen atom cannot produce spectral lines, a very hot star has very dim hydrogen Balmer lines, even though it contains great quantities of hydrogen. Conversely, if a star is much cooler than 10,000 K, most of the photons that pass through its photosphere possess too little energy to keep many electrons there in the n = 2 (first excited state) of the hydrogen atoms, or to boost electrons in the n = 2 state to higher energy states. Therefore, these stars also produce dim Balmer lines. To produce strong Balmer lines, a star must be hot enough to excite electrons out of the n = 2 state but not hot enough to ionize a significant fraction of the atoms.
352
Margin Question 11-5
Question
Why do very hot stars have weak hydrogen lines, even though they are composed primarily of hydrogen?
As you can see in Figure 11-5, at temperatures much cooler than 10,000 K, the spectral lines of other elements dominate a star’s spectrum. For example, the spectral line of neutral sodium, Na I, while dim at around 10,000 K, is quite strong at around 3700 K because photons have enough energy to excite electrons in sodium atoms without ripping them out of orbit. By surveying the relative strengths of a variety of absorption lines, astronomers can determine a star’s surface temperature to high precision.
11-6 Stars are classified by their spectra
We have seen that astronomers can determine a star’s surface temperature from either the peak of its blackbody or the strength of its various spectral lines. To make use of the diverse stellar spectra, astronomers since the middle of the nineteenth century have grouped similar spectra into classes, or spectral types. According to one classification scheme popular in the late 1800s, a star was assigned a letter between A and P, depending on the strength of the Balmer hydrogen lines in the star’s spectrum. It was assumed that the strength of these lines was uniquely related to the star’s surface temperature, but as we have seen in the preceding section, this belief is unjustified.
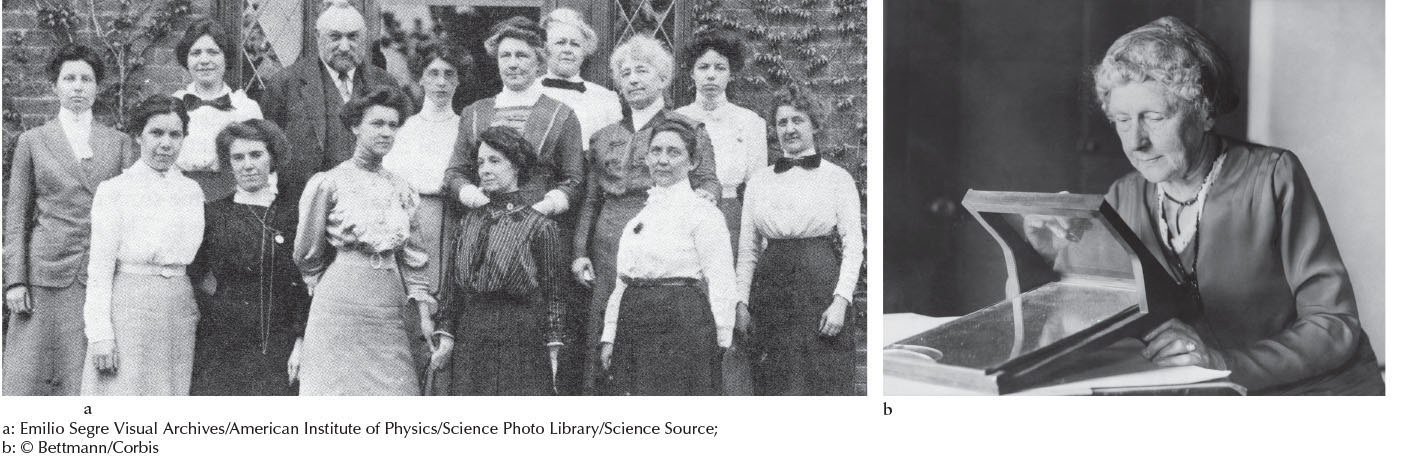
In the early 1900s, Edward C. Pickering (1846–1919) and Williamina Fleming (1857–1911), followed by Annie Jump Cannon (1863–1941), and their colleagues at Harvard Observatory (Figure 11-6) set up the spectral classification scheme we use today. Many of the early A through P categories were dropped because the Balmer lines in a star’s spectrum can be weak whether the star is very cool or very hot. The remaining Balmer-based spectral types were thus reordered by stellar surface temperature into the OBAFGKM sequence. This sequence is most easily learned with the aid of a mnemonic, such as “Oh, Be A Fine Guy (or Girl), Kiss Me!”
The hottest stars have surface temperatures of 30,000 to 50,000 K and are classified as O type; their spectra are dominated by He II (singly ionized helium) and Si IV (triply ionized silicon). The coolest stars have surface temperatures of 2500 to 3000 K and are classified as M type. Table 11-1 includes representative examples of each spectral type.
The wide range of temperatures covered by each spectral type prompted astronomers to further subdivide the OBAFGKM temperature sequence. Each spectral type is now broken up into 10 temperature subranges. These 10 finer steps are indicated by adding an integer from 0 (hottest) through 9 (coolest). Thus, an A8 star is hotter than an A9 star, which is hotter than an F0 star, which is hotter than an F1 star, and so on. The Sun, whose spectrum is dominated by singly ionized metals (especially Fe II and Ca II), is a G2 star.
353
| Spectral class | Color | Temperature (K) | Spectral lines | Examples |
|---|---|---|---|---|
| O | Blue-violet | 50,000–30,000 | Ionized atoms, especially | Naos (ζ Puppis), helium Mintaka (δ Orionis) |
| B | Blue-white | 30,000–11,000 | Neutral helium, some hydrogen | Spica (α Virginis), Rigel (β Orionis) |
| A | White | 11,000–7500 | Strong hydrogen, some ionized metals | Sirius (α Canis Majoris), Vega (α Lyrae) |
| F | Yellow-white | 7500–5900 | Hydrogen and ionized metals, such as calcium and iron | Canopus (α Carinae), Procyon (α Canis Minoris) |
| G | Yellow | 5900–5200 | Both neutral and ionized metals, especially ionized calcium | Sun, Capella (α Aurigae) |
| K | Orange | 5200–3900 | Neutral metals | Arcturus (α Boötis), Aldebaran (α Tauri) |
| M | Red-orange | 3900–2500 | Strong titanium oxide and some neutral calcium | Antares (α Scorpii), Betelgeuse (α Orionis) |
Insight Into Science: Tolerate Idiosyncrasies
In astronomy, the word metal applies to all elements other than hydrogen or helium. In chemistry, elements are classified as metals or nonmetals according to their physical and chemical properties. To a chemist, sodium and iron are metals, whereas carbon and oxygen are not.