Blackbody Radiation
We begin our study of why we see what we see with a familiar property of matter—temperature. We will discover that for many astronomical objects, their temperatures determine the relative numbers of photons that they emit at all different wavelengths.
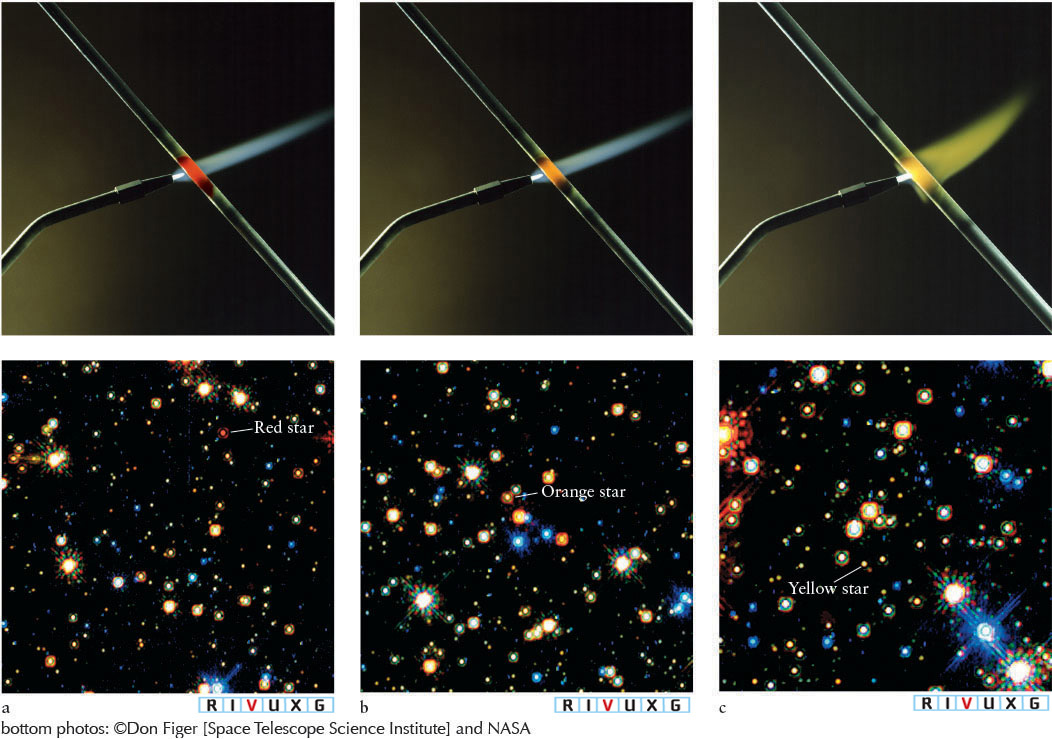
4-1 An object’s peak color shifts to shorter wavelengths as it is heated
Imagine that you have mounted an iron rod in a vise in a completely darkened room. You cannot see the rod because it emits too few visible photons, and you cannot feel its warmth without touching it because it is at the same temperature as the air in the room. Now imagine that there is also a propane torch in the room. You light it and heat the iron rod for several seconds, until it begins to glow. At the same time, you can feel the rod warm up, meaning that it is also emitting more infrared radiation.
 The rod’s first visible color is red—it glows “red hot” (Figure 4-1a). Heated a little more, the rod appears orange and brighter, and feels hotter (Figure 4-1b). Heated more, it appears yellow and brighter still, and feels even hotter (Figure 4-1c). After even more heating, the rod appears white-hot and brighter yet. If it does not melt, further heating will make the rod appear blue and even brighter, and feel even hotter. As confirmed by the photographs in Figure 4-1, this experiment shows how the amount of electromagnetic radiation that any object emits changes with its temperature. A “red-hot” object is the coolest of all glowing bodies.
Insight Into Science: Many Phenomena Result from Several Effects
Recall from Chapter 3 that white is not a fundamental color. Why then do objects at certain temperatures appear “white-hot,” whereas cooler ones are red, orange, or yellow, and hotter ones appear blue or violet? The answer is that when blackbodies peak in the green part of the spectrum, all the color-sensitive cones in our eyes are stimulated about evenly, an effect that the brain interprets as “white.”
If you were to put the light emitted by a heated object, like the iron rod, through a prism or diffraction grating (which separates the colors of light, just like a prism), you would discover that all wavelengths are present and that one is brightest. This peak wavelength is the color that the object appears to have. The experiment with the rod reveals two principles about the electromagnetic radiation emitted by objects as their temperatures change:
- As an object heats up, it gets brighter, emitting more electromagnetic radiation at all wavelengths.
- The brightest color (most intense wavelength) of the emitted radiation changes with temperature.
107
Most objects big enough to be seen with the naked eye continuously emit electromagnetic radiation as just described. The peak wavelength of any object’s radiation, that is, where it emits most intensely, is denoted λmax. When the object is relatively cool, such as a rock or an animal, λmax is a radio, microwave, or infrared wavelength. When it is hot enough, like a fire or the Sun, λmax is in the range of visible light, giving a hot object its characteristic color. Exceptionally hot objects, such as some stars, emit λmax in the ultraviolet part of the electromagnetic spectrum.
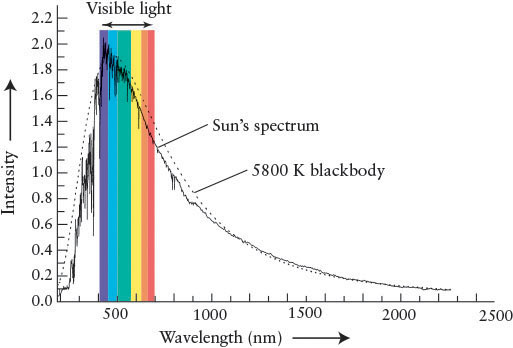
Stars, molten rock, and iron bars are approximations of an important class of objects that scientists call blackbodies. An ideal blackbody absorbs all of the electromagnetic radiation that strikes it. This incoming radiation heats up the blackbody, which then reemits the energy it has absorbed, but with different intensities at each wavelength than it received. Furthermore, the pattern of radiation emitted by blackbodies is independent of their chemical compositions. By measuring the intensity of radiation emitted by a blackbody at several wavelengths, it is possible to plot a curve of its emissions over all wavelengths (Figure 4-2). Ideal blackbodies have smooth blackbody curves, whereas objects that approximate blackbodies, such as the Sun, have more jagged curves whose variations from the ideal blackbody are caused by other physics (Figure 4-3).
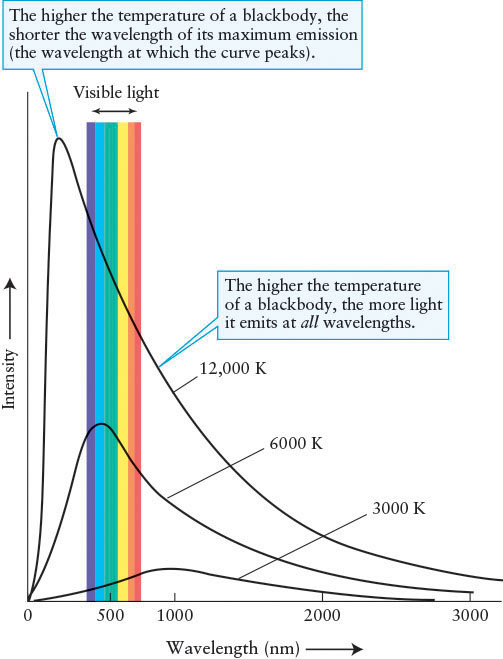
 Blackbody Curves Three representative blackbody curves are shown here. Each curve shows the intensity of radiation over a wide range of wavelengths emitted by a blackbody at a particular temperature.
Margin Question 4-1
Question
Referring to Figure 3-6 if necessary, where on the horizontal axis are radio waves relative to visible light in Figure 4-2?
The total amount of radiation emitted by a blackbody at each wavelength depends only on the object’s temperature and how much surface area it has. The bigger an object is, the brighter it is at all wavelengths. However, the relative amounts of different wavelengths (for example, the intensity of light at 750 nm compared to the intensity at 425 nm) depend on just the body’s temperature. So, by examining the relative intensities of an object’s blackbody curve, we are able to determine its temperature, regardless of how big or how far away it is. This process is analogous to how a thermometer tells your internal temperature no matter how big you are. (Temperatures throughout this book are expressed in kelvins. If you are not familiar with the Kelvin temperature scale, review Appendix D: Temperature Scales.)
108
Rather than absorb and reradiate light from an outside source like our iron rod, stars radiate electromagnetic radiation that is generated inside them. Even so, stars behave nearly like blackbodies, and the self-generated radiation they emit follows the idealized blackbody curves fairly well.
4-2 The intensities of different emitted colors reveal a star’s temperature
In 1893, the German physicist and 1911 Nobel laureate Wilhelm Wien (1864–1928) showed that
The peak wavelength of radiation emitted by a blackbody is inversely proportional to its temperature.
In other words, the hotter any object becomes, the shorter its λmax, and vice versa. Wien’s law, often called Wien’s Displacement Law, is the mathematical relationship between the location of the peak for each curve in Figure 4-2 and that blackbody’s temperature.
Wien’s law proves very useful in computing the surface temperature of a star. It says that to determine that temperature, all we need to find is the peak wavelength of its electromagnetic radiation—we do not need to know the star’s size, distance, or any other physical property.
In 1879, the Austrian physicist Josef Stefan (1835–1893) observed that
An object emits energy per unit area at a rate proportional to the fourth power of its temperature in kelvins.
Think of the electric heating element on a stove. As this device becomes hotter, it gets brighter and emits more energy. Stefan’s result says that if you double the temperature of an object (for example, from 500 to 1000 K), the energy emitted each second from each piece of the object’s surface increases by a factor of 24, or 16 times. If you triple the temperature (for example, from 500 to 1500 K), the rate at which energy is emitted increases by a factor of 34, or 81 times. Stefan’s results were put on a firm theoretical foundation by Ludwig Boltzmann (1844–1906) in 1885. In their honor, the intensity-temperature relationship for blackbodies is named the Stefan-Boltzmann law.
The Stefan-Boltzmann law and Wien’s law are powerful tools that describe two basic properties of blackbody radiation, namely, the relative rate at which photons of all different wavelengths are emitted and the wavelength that is emitted most intensely. If you would like to learn how to use these two radiation laws to make predictions, see An Astronomer’s Toolbox 4-1: The Radiation Laws.
Blackbody curves, such as those shown in Figure 4-2, provide the same information as Wien’s law and the Stefan-Boltzmann law, as well as show the intensity of each blackbody at all wavelengths. Note that the blackbody curves for objects with different temperatures never touch or cross. Therefore, when astronomers measure the intensity of radiation from a star at a few wavelengths, they can determine the object’s temperature by fitting these measurements to the appropriate, unique blackbody curve.
109
AN ASTRONOMER’S TOOLBOX 4-1: The Radiation Laws
Wien’s law can be stated as a simple equation. If λmax, the wavelength of maximum intensity, is measured in meters and T is the temperature of the blackbody measured in kelvins, then
λmax = 2.93 × 10⁻³/T
Example: The Sun’s maximum intensity is at a wavelength of about 500 nm, or 5 × 10⁻⁷ m. From Wien’s law, we can calculate the Sun’s surface temperature as
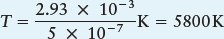
The total energy emitted from each square meter of an object’s surface each second is called the energy flux, F. In this context, flux means “rate of flow.” The energy flux is related to the temperature, T, by the equation
F = σT4
where σ (lowercase Greek sigma) is called the Stefan-Boltzmann constant. It has a value of
σ = 5.67 × 10⁻⁸J/(m2 · K4 · s)
with J being the energy unit joules, m the unit meters, K the unit kelvins, and s the unit seconds.
Because F is the energy emitted per second from each square meter of an object, multiplying F by the surface area, 4πr2, where r is the object’s radius, yields the total energy emitted by a spherical object each second. This quantity, denoted L, is called luminosity:
L = F · 4πr2 = σT44πr2
Luminosity is the total energy emitted per second by an entire object.
Compare! We consider one application of the Stefan-Boltzmann law. Suppose you observe two stars of equal size—one with a surface temperature of 10,000 K and the other with the same surface temperature as the Sun (5800 K). You can use the Stefan-Boltzmann law to determine how much brighter the hotter star is:
So, the hotter star emits about 8.8 times as much energy from each square meter of its surface than does the cooler star. Because the stars are the same size, the hotter one is therefore 8.8 times brighter than the cooler one.
Try these questions: The color yellow is centered around 550 nm. If the Sun were actually yellow, what would be its surface temperature? (To find out why it is not yellow, see Guided Discovery: The Color of the Sun.) What is the peak wavelength in nanometers given off by a blackbody at a room temperature of 300 K? Referring to Figure 3-6, what part of the electromagnetic spectrum is that in?
(Answers appear at the end of the book.)
Although intensity curves of stars closely “follow” blackbody curves, they are not ideal blackbodies. The differences between an ideal blackbody curve and the curves seen from actual stars reveal stellar chemistries, the presence of companion stars and planets too dim to see, and the motions of stars toward or away from us, among other information. We begin studying these issues by considering the actual spectrum of the Sun.
Margin Question 4-2
Question
If a blackbody’s peak wavelength is in the infrared, the object is often visible to our eyes. What color will it have?
 Figure 4-3 shows how the intensity of sunlight varies with wavelength. The blackbody curve for a body with a temperature of 5800 K is also plotted in this figure. Note how the observed intensity curve for the Sun nearly reproduces the ideal blackbody curve at most wavelengths. The differences in the two curves are due to photons removed from the Sun’s blackbody radiation by gases between the Sun’s visible surface and our eyes. We discuss this phenomenon further shortly. Because the observed intensity curves for most stars and the idealized blackbody curves are so closely correlated, the laws of blackbody radiation can be applied to starlight. The peak of the intensity curve for the Sun is at a wavelength of about 500 nm, which is in the blue-green part of the visible spectrum. To understand why the Sun appears yellow, read Guided Discovery: The Color of the Sun.
110
GUIDED DISCOVERY: The Color of the Sun
Different people perceive the Sun to have different colors. To some it appears white, to others yellow. Still others, who notice it at sunrise or sunset, believe it to be orange or even red. But we have seen that the Sun actually emits all colors. Moreover, the peak in the Sun’s spectrum falls between blue and green. Why doesn’t the Sun appear turquoise? Several factors affect our perception of its color.
Before reaching our eyes, visible sunlight passes through Earth’s atmosphere. All wavelengths are absorbed and reemitted by the molecules in the air, a process called scattering. Violet light is scattered most strongly, followed in decreasing order by blue, green, yellow, orange, and red. Thus, more violet, blue, and green photons are scattered by Earth’s atmosphere than are yellow photons. The intense scattering of violet, blue, and green has the effect of shifting the peak of the Sun’s intensity entering our eyes from blue-green toward yellow. (The sky is blue because of the strong scattering of blue light—it isn’t violet because the Sun emits many fewer violet photons than blue ones.)
The perception of a yellow Sun is further enhanced by our eyes themselves. Our eyes do not see all colors equally well. Rather, the light-sensitive cones in our eyes each respond to one of three ranges of colors, which are centered on red, yellow, and blue wavelengths. None of the cones is especially sensitive to blue-green photons. By adding together the color intensities detected by the three types of cones, our brains re-create color. After combining all of the light that it can, the eye is most sensitive to the yellow-green part of the spectrum. We see blue and orange less well and violet and red most poorly. Although the eyes see yellow and green light about equally well, the Sun appears yellow because the air scatters more green light than yellow and our eyes are relatively insensitive to blue-green. Therefore, a casual glance at the Sun often leaves the impression of a yellow object.
Above Earth’s atmosphere, the Sun’s light is so intense that it saturates the color-sensitive cones in our eyes. My astronaut friends all describe the Sun as seen in space as “blindingly white.”
At sunrise and sunset we see an orange or red Sun. This coloration occurs because close to the horizon the Sun’s violet, blue, green, and even yellow photons are all strongly scattered by the thick layer of atmosphere through which they travel, leaving the Sun looking redder and redder as it sets.


111
WHAT IF…: The Sun [em]did[/em] have its peak emission in the yellow part of the spectrum?
In that case, the Sun’s surface temperature would be 5100 K, rather than 5800 K, and Earth (in its present orbit) would be considerably colder overall than it is today.
The shapes of ideal blackbody curves were first derived from basic physical principles (and a deeper understanding of matter and energy than was available to Ludwig Boltzmann) in 1900 by the German physicist Max Planck (1858–1947). To determine these curves, he had to assume that objects receive electromagnetic radiation as individual packets of energy. This surprising assumption was reinforced in 1905 by Albert Einstein, who suggested that light—a wave—also behaves as particles (photons), as discussed in Section 3-3. Planck was awarded the Nobel Prize in 1918 for his ideas about photons. Einstein’s 1921 Nobel Prize was for related work (he did not earn it for his development of special or general relativity, which we study in Chapter 14).
We can now describe our experiment with the iron bar at the beginning of this chapter in terms of the energies and intensities of photons. Recall from Section 3-3 that the energy carried by a photon is inversely proportional to its wavelength. In other words, long-wavelength photons, such as radio waves, carry little energy, while short-wavelength photons, like X-rays and gamma rays, each carry much more energy. When the rod was cool, it mostly emitted lower-energy infrared and radio photons; as it heated up, it emitted more and more photons of all wavelengths and therefore glowed more, eventually emitting mostly visible photons, which is why it looked brighter, felt hotter, and changed color.
The relationship between the intensity of electromagnetic radiation at every wavelength emitted by a given blackbody and its temperature is called Planck’s law (Table 4-1): Planck’s law gives the shapes of the curves in Figure 4-2. To summarize: A cool object emits primarily long-wavelength photons that carry little energy, while a hot object emits mostly short-wavelength photons that carry much more energy. Furthermore, hotter objects emit more photons of all wavelengths than do cooler objects and, according to Wien’s law, the hotter a blackbody, the shorter the wavelength of the peak of its emission. In later chapters, we will find these relationships invaluable for understanding how stars of various temperatures interact with gas and dust in space.
| Wavelength (nm) | Photon energy (eV)* | Peak of blackbody temperature (K) | |
|---|---|---|---|
| Radio | >107 | <10−4 | <0.03 |
| Microwave** | 107 to 4 × 10⁵ | 10−4 to 3 × 10⁻³ | 0.03 to 30 |
| Infrared | 4 × 10⁵ to 7 × 10² | 3 × 10⁻³ to 2 | 30 to 4100 |
| Visible | 7 × 10² to 4 × 10² | 2 to 3 | 4100 to 7300 |
| Ultraviolet | 4 × 10² to 101 | 3 to 103 | 7300 to 3 × 10⁶ |
| X-ray | 101 to 10−2 | 103 to 105 | 3 × 10⁶ to 3 × 10⁸ |
| Gamma ray | <10−2 | >105 | >3 × 10⁸ |
| Note: > means greater than; < means less than | |||
| *1 eV (electron volt) = 1.6 × 10⁻¹⁹ J | |||
| **Microwaves, listed here separately, are often classified as radio waves or infrared radiation. | |||