Chapter 5. Chapter 5: Human Populations
What do population growth rates look like today...

Guiding Question 5.4
What do population growth rates look like today, and how can we achieve zero population growth?
Why You Should Care
It is clear that human population growth should be a global concern, but it seems like an issue that any one individual is helpless to improve. Experience has shown that the single most effective means of reducing population growth rates in a country is to improve the education, job opportunities, and civil rights of women. The more control women have over their reproductive rights and their lives in general, the less likely they are to have large families. This is just one of many reasons that the quality of life for women in developing countries should be of paramount concern to humanitarian organizations and movements.
Question Sequence
Question 5.1
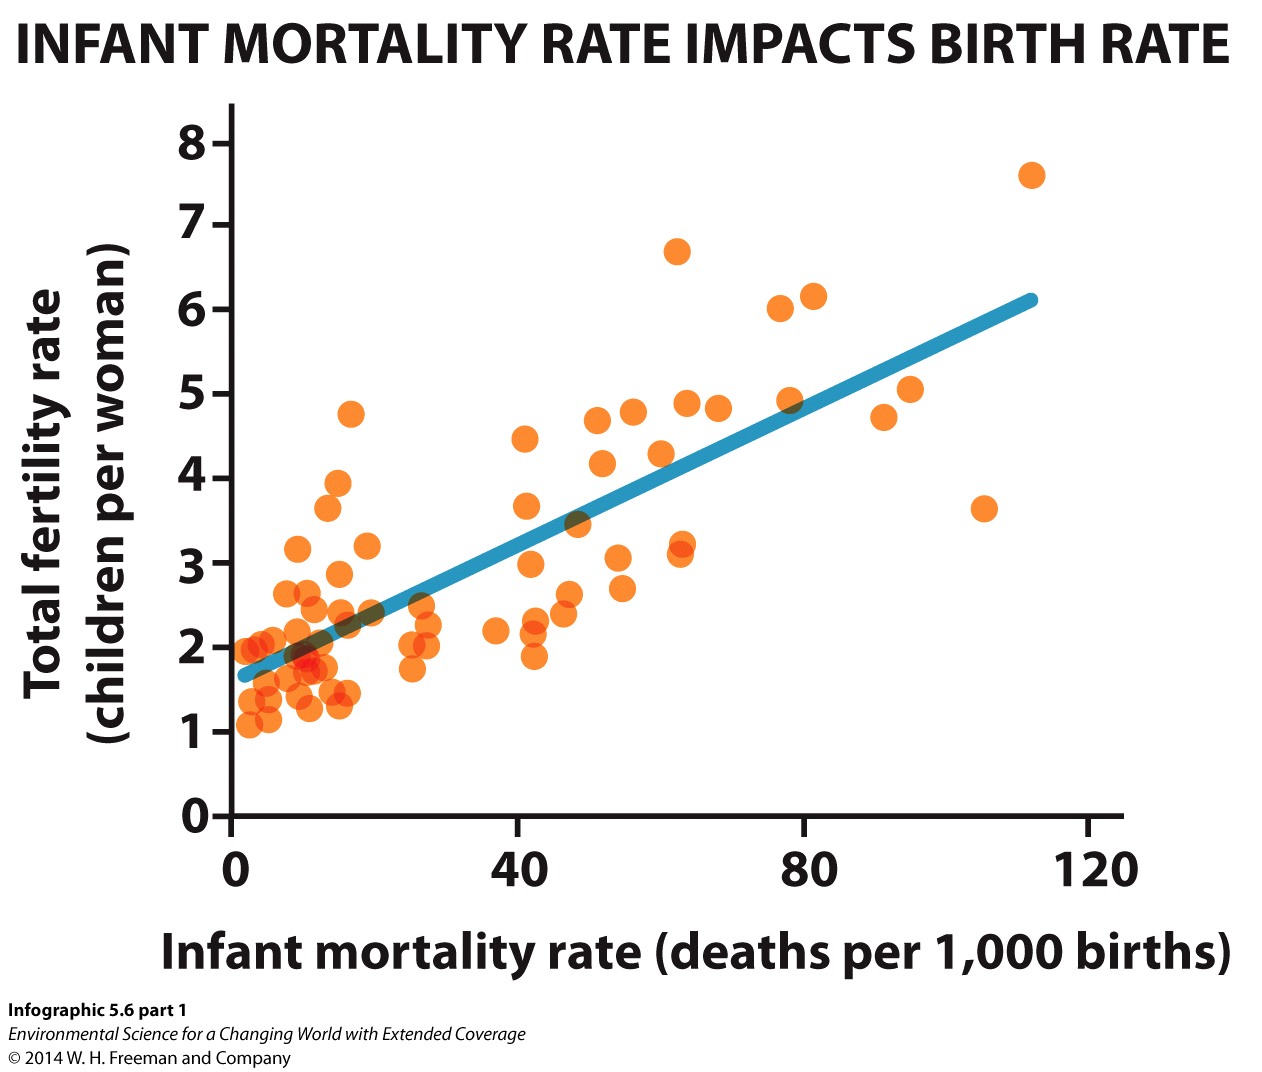
2) High infant mortality rates are associated with lower standards of living and more poverty. Impoverished parents may decide to have a large family because they can provide help for their work and because more children means more security in the parents’ old age.
Question 5.2
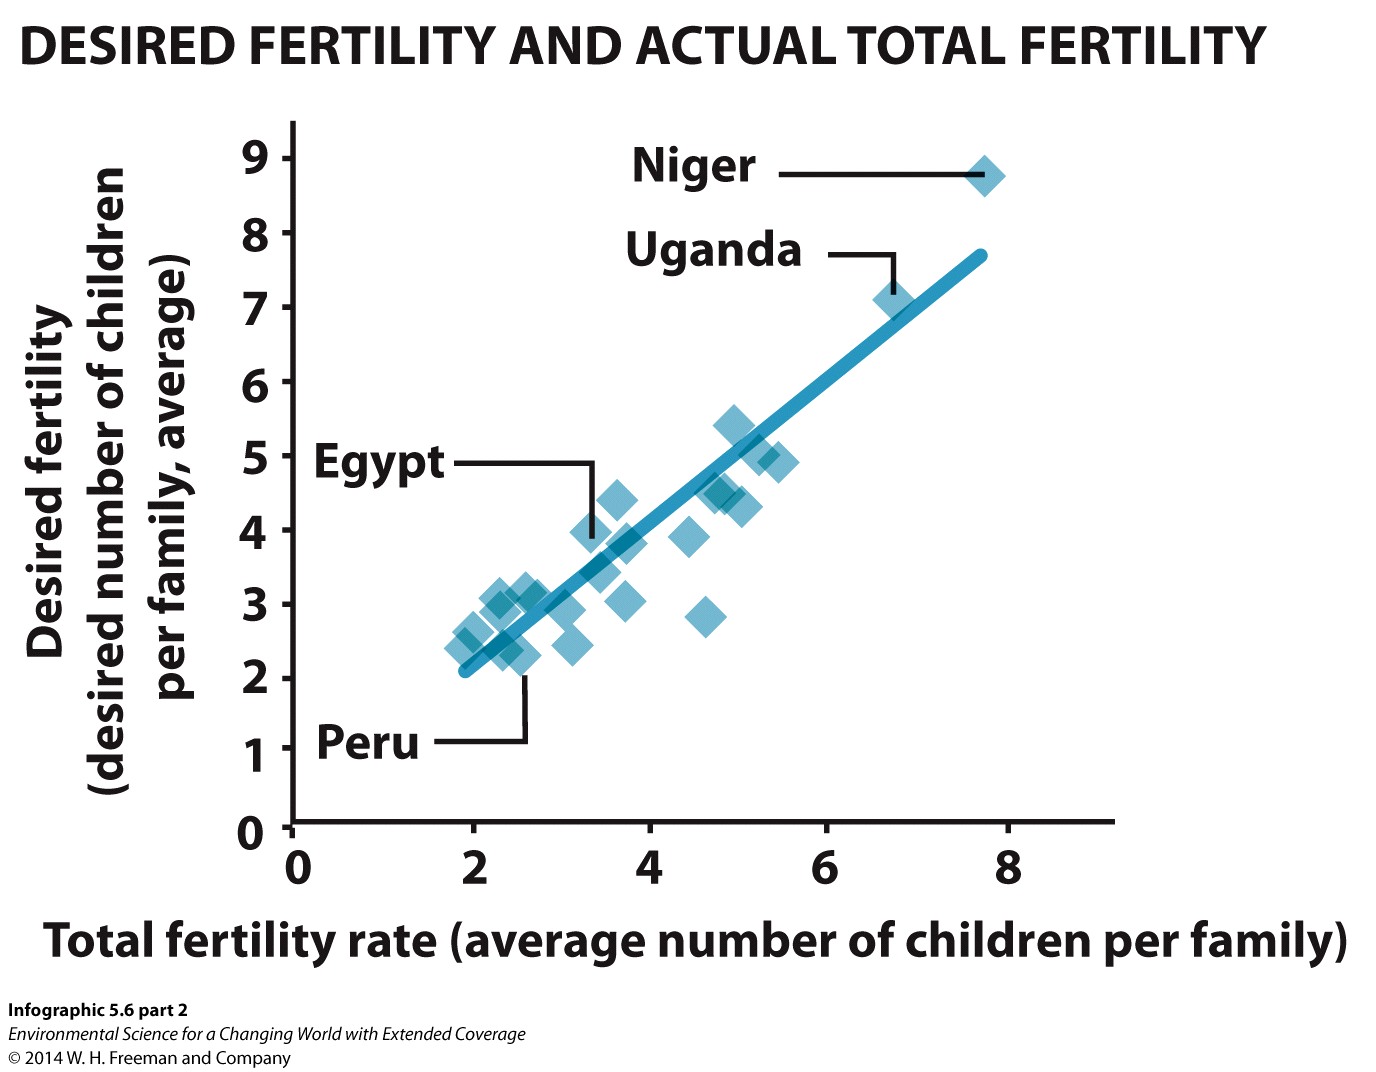
A) Interpreting a graph: Examine the graph of desired fertility and actual total fertility. The line through the points is sometimes referred to as a “best fit line” and represents the statistical relationship between total fertility and desired fertility as determined by the actual empirical data points displayed as square dots. Think back to your algebra lessons and describing the slope of a line: rise over run. Examine different points for desired children on the line and find the corresponding number for total fertility. What best describes the mathematical relationship of desired fertility to total fertility (desired children to actual children)? 75MvhFH097sCuF6/KiPecHIuKuAeQh9bGJtsaIeFYofSdQT3
a0ss6j85GLn8/+eJ9P5dDksgSyuSHlY/jUn2QMLnG9AxXNYf7s/fGPZmPENhH+FFI3KcIpNOiK7ds8sjjKgBhzoZRFN/znpCcI/IQuD9OIYuhKU9hoOxfihWWvvmt8eyre10JHwq2rauAtBHuvaAOuzM2/O0yI70Cb4sUKxj7L/9wJDi4VRfuVHUogThjzNVC5VVx0QgzPfvs7MpenEEAM00hcIUYqTPJgDGlA==B) There are only around 20 points on the graph, so not every country in the world is represented. Furthermore, all of the countries identified are developing. This suggests that the graph was made using a sample of developing countries.
B) There are only around 20 points on the graph, so not every country in the world is represented. Furthermore, all of the countries identified are developing. This suggests that the graph was made using a sample of developing countries.
Question 5.3
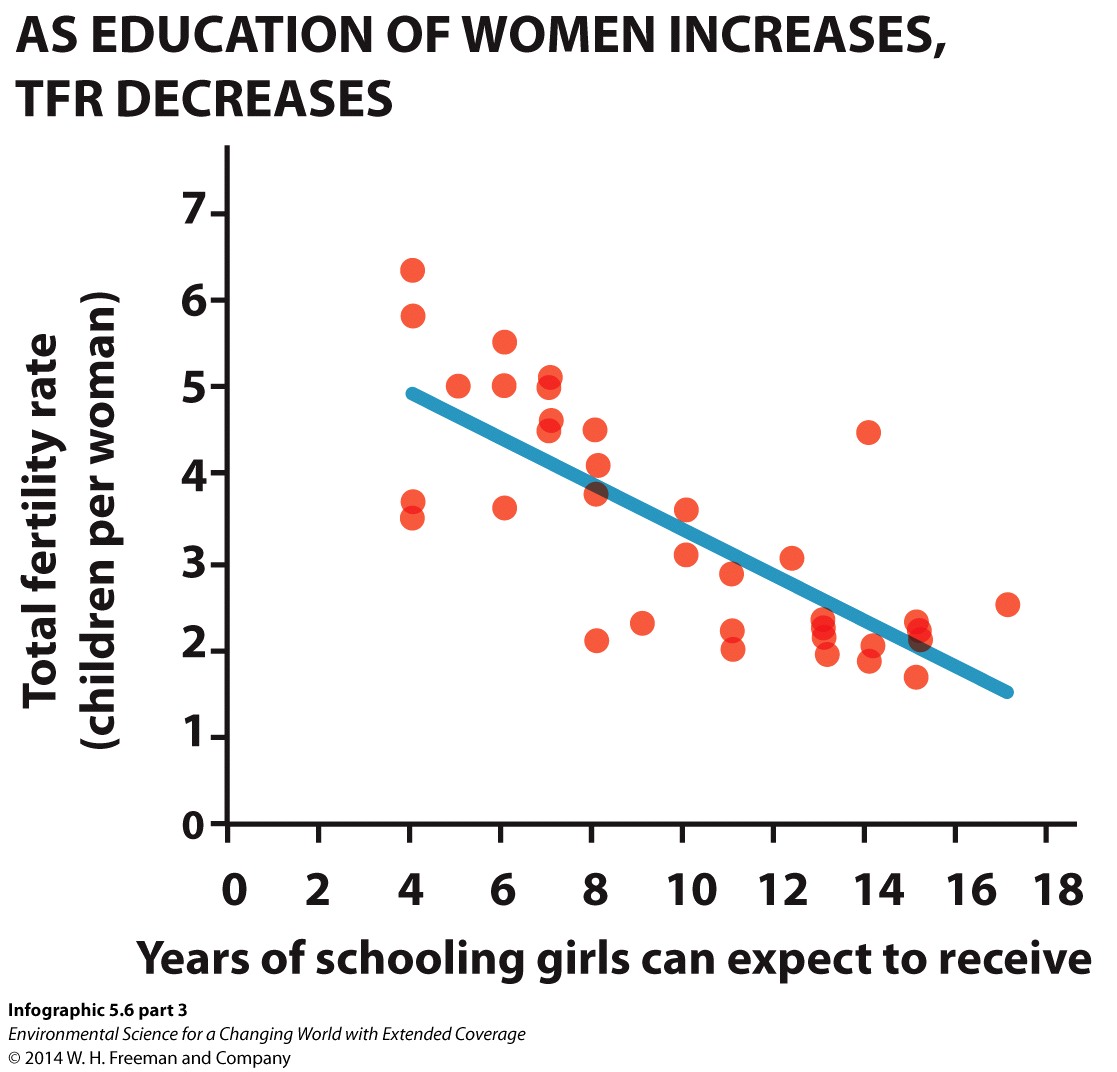
A) Interpreting a graph: Examine the graph above. About how many extra years of schooling does it take to reduce total fertility rate by one child?r15mzkvjT2PEZanmdn198OQnTAmokpi9M/sz4cCDSALTYtHHCMzKTQ==
2i2zB8q8w86nsV7ba0p1Aw8dr+xRzJHZeRTWOFaujtsxckxNxtd4cSvIsXf8g9GjWW+2gUgmjpiXs02GwNBthRh6dvDH9NIjYBDlt4bLwkAIOpzxLMwF6lTeHGO4VCU+8rrm/hPGS4VJEzbbEJWaUDuTONSW1HOpCBxLvK23pRSh2+oOC0QjlEac/Eb1PmaoB) Probably not, although it is common for TFR to drop below the replacement fertility rate in post-industrial countries, it is unlikely that all couples will decide not to have children.
B) Probably not, although it is common for TFR to drop below the replacement fertility rate in post-industrial countries, it is unlikely that all couples will decide not to have children.
Question 5.4
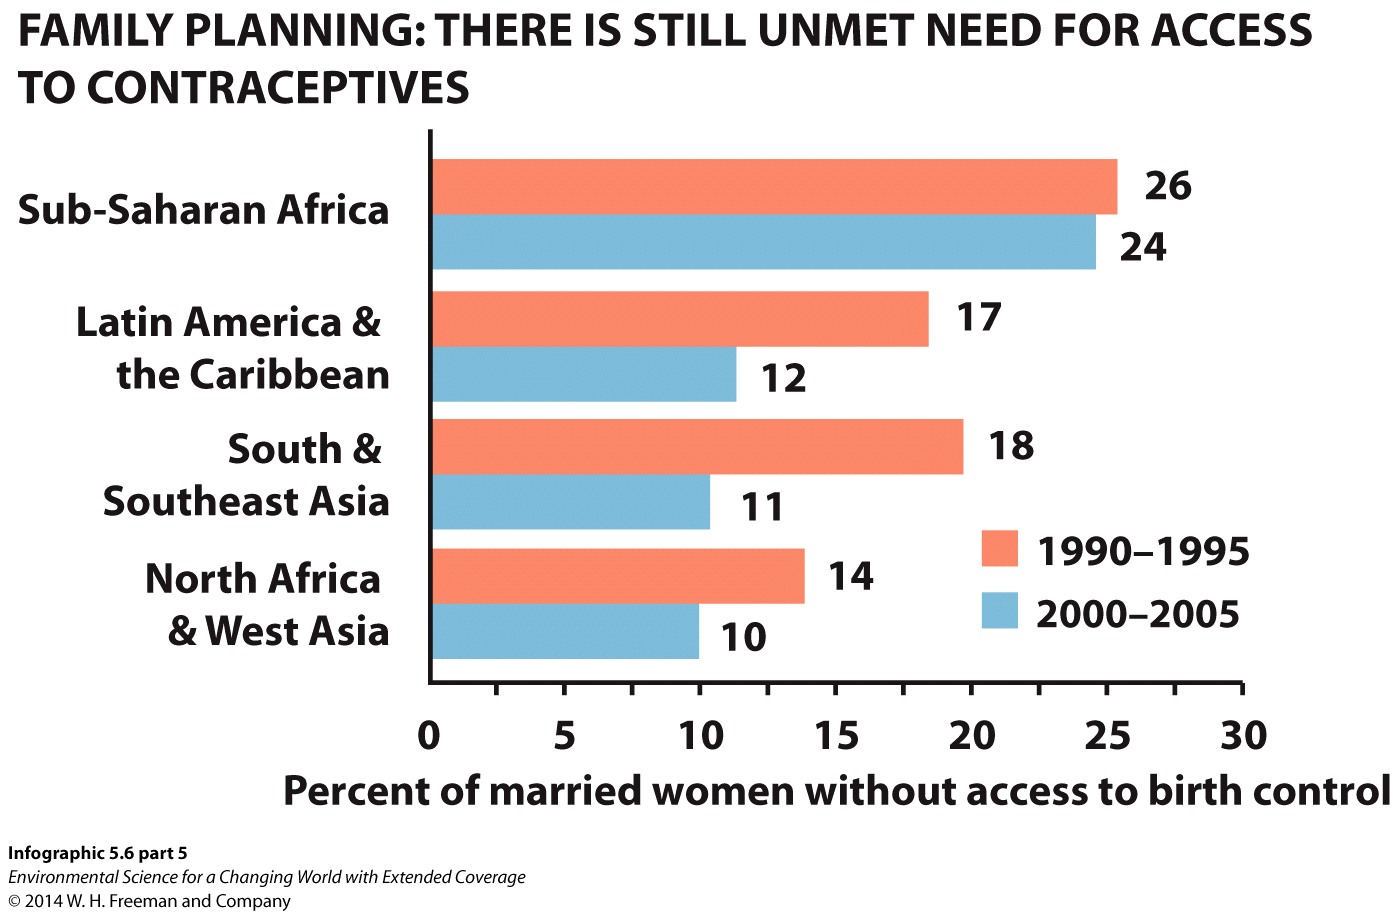
Interpreting a graph: Examine the family-planning graph. The region with the most improvement in birth-control access from the 1990s to the 2000s is ro8iZkppW6A+sLTBs0TmSPs4HnWlIbyuFdsZzW22CUuTGapSX1YxlnGxdytAiDMIhllOXWAz7gUdZljGNbvNf7pbYiDC3tPNyxYCeptUkfC9t5EWRoWShxvguJOclS3Te2RUdHAYn2xiPTvdiEZbiU52Mwc=, whereas the region with the least improvement is KUUHc0aKmhQ4VTJbD/Brcel6KnV3wx1QY0Mhjo5XPvPBFjNTlNCmlnEzr9MA2VWomoWvepK9vBaWUhZMen1I3wHj0qBCfSxHtCvYMI+iWl2ddyxdJNxmEkQbZvIpUD2EXrPmYhjxLXopYaq8Xf1nAgGs+VA=. The region with the best access to birth control overall is vblZEkGnqkyltD0gdXwM7B/y8fVnCNKq3zZpW3hsaSq77dF6dR1hd/eCRuWdlQgc222wYrNpg3rf8Dej5/i+pd+977v06jrX0/SlkMFDE+m1Lmr0upnWH1MDkPoNzWbEwZ116hP36C1xd13KEX2fq3zBS18=; the region with the worst access is KUUHc0aKmhQ4VTJbD/Brcel6KnV3wx1QY0Mhjo5XPvPBFjNTlNCmlnEzr9MA2VWomoWvepK9vBaWUhZMen1I3wHj0qBCfSxHtCvYMI+iWl2ddyxdJNxmEkQbZvIpUD2EXrPmYhjxLXopYaq8Xf1nAgGs+VA=.