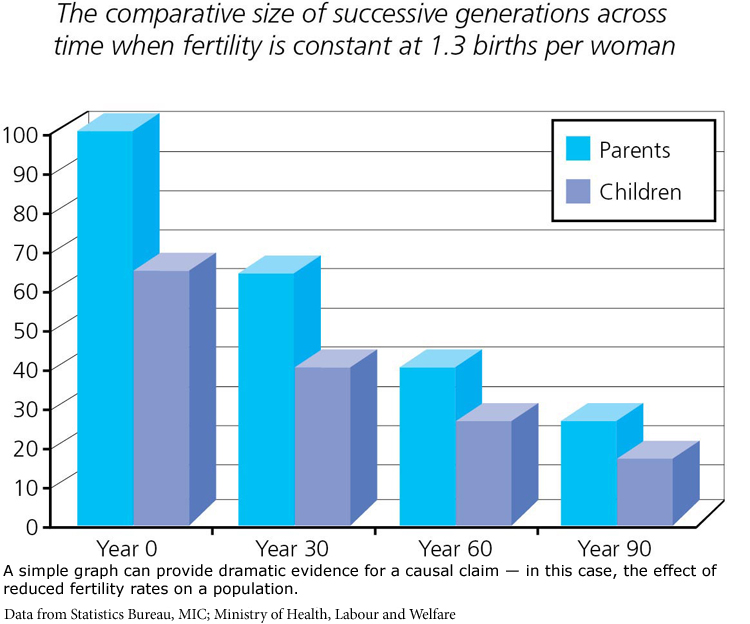
A simple graph can provide dramatic evidence for a causal claim — in this case, the effect of reduced fertility rates on a population.