Writing Projects
![]() Writing Projects
Writing Projects
Question 18.97
1. A human infant at birth usually weighs between 5 and 10 lb and has a height (length) between 1 and 2 ft, with the shorter babies having the lesser weight. Considering the weight and height of an adult human, write a paragraph arguing that human growth must not be just proportional growth.
Question 18.98
2. That area scales with the square of length, and volume with the cube of length, has important consequences for the depiction and interpretation of data graphics. Suppose we wish to indicate in an artistic way that the disposable income (after taxes) of a typical U.S. worker is twice that of a typical worker in France, by showing that the U.S. worker’s income can buy twice as expensive a car. We draw one car for the French worker and another one—fancier and “twice as large”—for the American.

776
What’s the problem? Well, first, people tend to respond to graphics by comparing areas. Because the larger car is twice as high and twice as long as the smaller one, its image has 4 times the area. Second, we are used to interpreting depth and perspective in drawings in terms of three-dimensional objects. Because the larger car is also, by implication, twice as wide as the smaller, it has 8 times the volume. The graphic can leave the subconscious impression that the U.S. worker has 8 times as much disposable income, instead of just twice as much. (Caution: Psychological studies show that the area perceived by a viewer does not exactly match the mathematical area.)
With these ideas in mind, evaluate—in a paragraph each—the data depictions in parts (a) through (c).
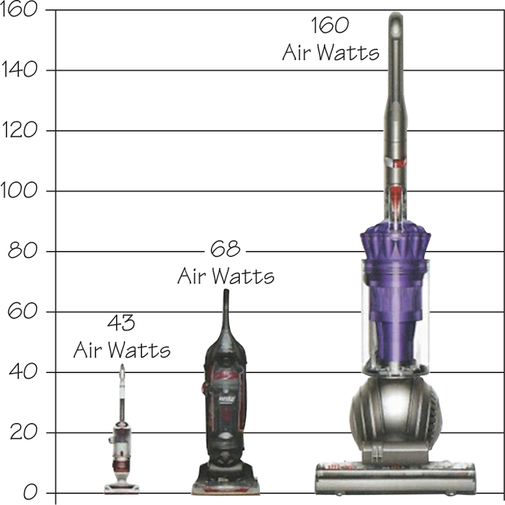
- “[A]s you can see, Dyson DC41 has twice the suction of any other vacuum.” (www.dyson.com)
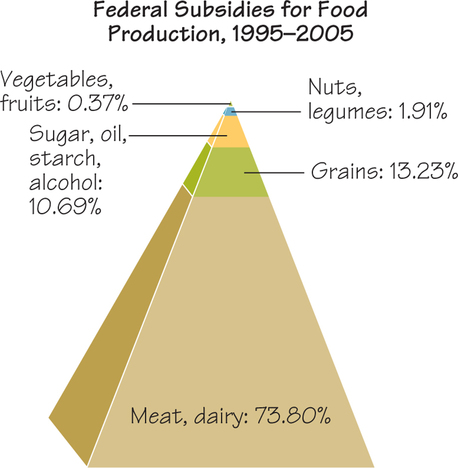
- Federal subsidies for food production, 1995-2005. (Why that salad costs more than a Big Mac, Readers Digest, October 2010, p. 72.)
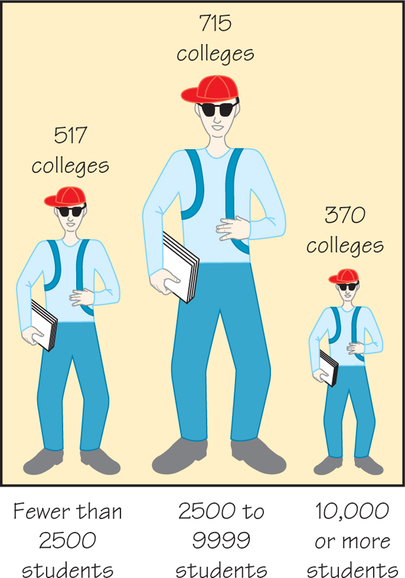
- U.S. colleges as classified by enrollment. (From David S. Moore, Statistics: Concepts and Controversies, 4th ed., W. H. Freeman, New York, 1997, p. 217.)
Question 18.99
3. Evaluate in a paragraph each of the depictions in parts (a) through (c).
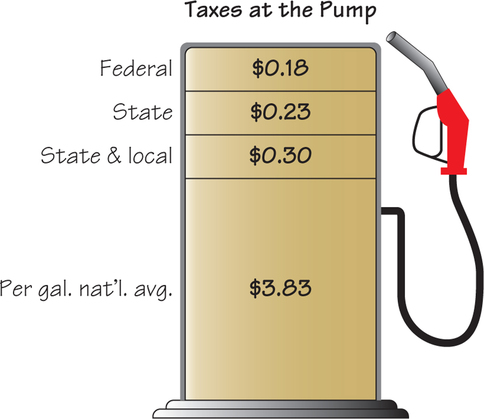
- Taxes on gasoline. (Fox News, Happening Now, 3/6/12 via Media Matters.)
777
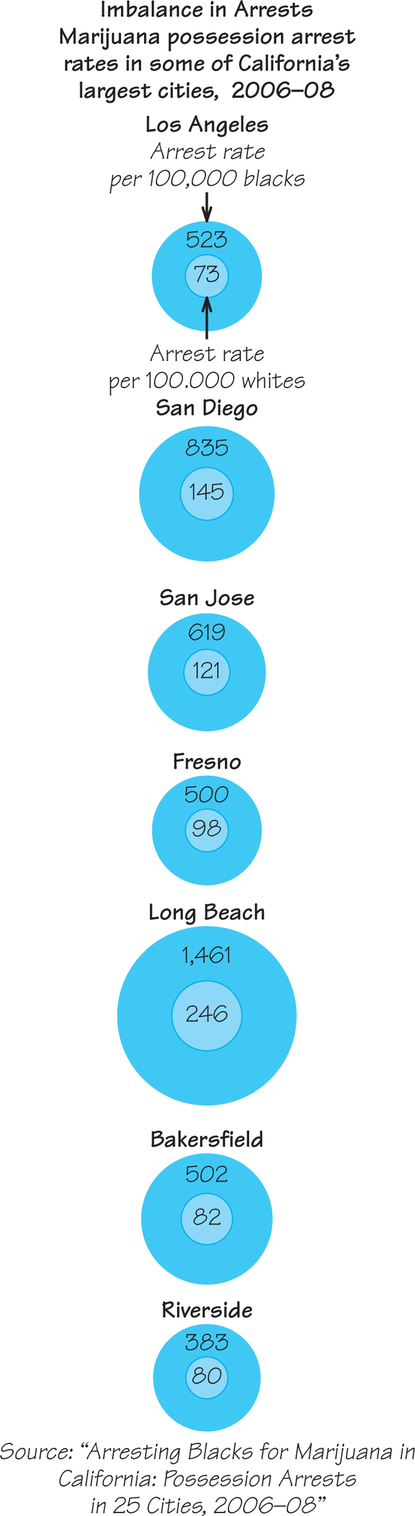
- Marijuana arrest rates in some California cities, 2006-2008. (New York Times, October 23, 2010, p. A19.)
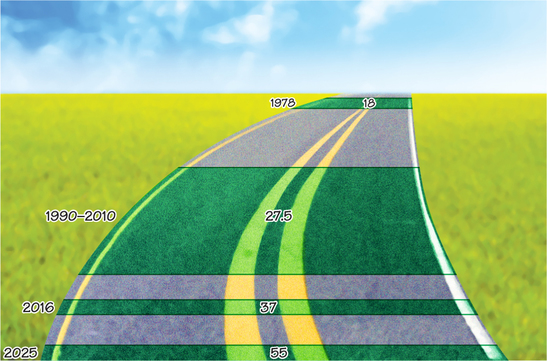
- U.S. fuel economy standards for autos (in miles per gallon) over the years.
Question 18.100
4. With the ideas of Writing Projects 2 and 3 in mind, collect and evaluate similar depictions of data from magazines and newspapers.
Question 18.101
5. Dolls and human figures are usually scaled to be geometrically similar to actual humans. But are dolls designed to represent babies or adult humans? Go to a toy store and measure the height, the vertical height of the head, and the arm length of some dolls and other figures. Scale your measurements to compare them with Figure 18.14 (page 763); from that comparison, try to estimate the ages of the humans that the figures resemble. Write up your procedure, data, calculations, and conclusions in a page or two.
Question 18.102
![]() 6. (Refer to Exercises 42–44.) Because body weight is average density times body volume, BMI is average density times a quantity that has units of length. Discuss whether BMI makes sense as a measure of being overweight. Would dividing by a different power of height make for a better measure? (See Keith Devlin, “Top 10 Reasons Why the BMI Is Bogus,” NPR, July 4, 2009, http://www.npr.org/templates/story/story.php?storyId=106268439.)
6. (Refer to Exercises 42–44.) Because body weight is average density times body volume, BMI is average density times a quantity that has units of length. Discuss whether BMI makes sense as a measure of being overweight. Would dividing by a different power of height make for a better measure? (See Keith Devlin, “Top 10 Reasons Why the BMI Is Bogus,” NPR, July 4, 2009, http://www.npr.org/templates/story/story.php?storyId=106268439.)
778