19.6 19.5 Fractal Patterns and Chaos
We noted earlier that similarity and repetition are key aspects of symmetry, as are balance and proportionality. In most of our examples, the repetitions of a motif have been at the same size. Exceptions were the chambers of the nautilus in Figure 19.2b (on page 780) and the varying sizes of leaves, seeds, and florets in plants that feature the spiral pattern of phyllotaxis (Figures 19.1 and 19.2a, on page 780). A further example in nature is a spiral galaxy. These phenomena exhibit a kind of “proportion,” or numerical symmetry—symmetry with changes of scale.
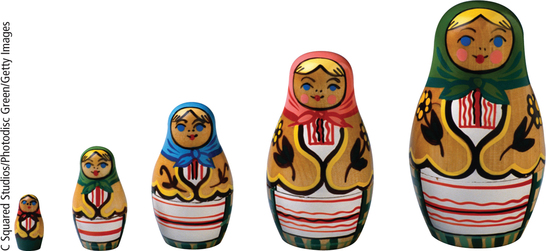
Another example of similarity but at different sizes is the nested dolls (known as matrioshka) shown in Figure 19.16. They feature a linear scaling factor (see Section 18.1 on page 738) between one doll and another. Each part of one doll (face, arm, etc.) has the same proportion (scaling factor) to the corresponding part of a second doll.
Fractals
Fractals are a kind of symmetry in which there is linear scaling of parts. The word fractal was invented in 1975 by Benoit Mandelbrot from the Latin word fractus meaning “broken into fragments” (of varied sizes), from which we get fragment and also fracture and fraction (see Spotlight 19.10). Mandelbrot defined a fractal in mathematical terms that we formulate more informally as follows.
808
The Father of Fractals Spotlight 19.10
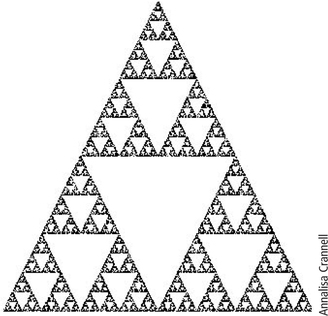
Benoit Mandelbrot (1924–2010) was born in Poland, spent part of his time growing up in France, and came to the United States to work for IBM. He found that many phenomena feature both repeating patterns and power curves (see Section 18.5 on page 764). The patterns are repeated at a change of scale, as Barnsley’s fern in Figure 19.19 and the Sierpiński triangle in Figure 19.20 show, and can be described by very simple rules. In 1975, he coined the term fractals, and the systems of rules became known as iterated function systems. The website for the course that he pioneered at Yale University (see the Suggested Websites at the end of this chapter) lists 100 or so examples of fractal phenomena in nature and society. Mandelbrot’s book The (mis)Behavior of Markets: A Fractal View of Risk, Ruin, and Reward (see the Suggested Readings at the end of this chapter) applies fractals to the movement of stock prices
Fractal DEFINITION
A fractal is a pattern that exhibits similarity at ever finer scales.
What this means is that no matter how closely we zoom in, we still see the same pattern.
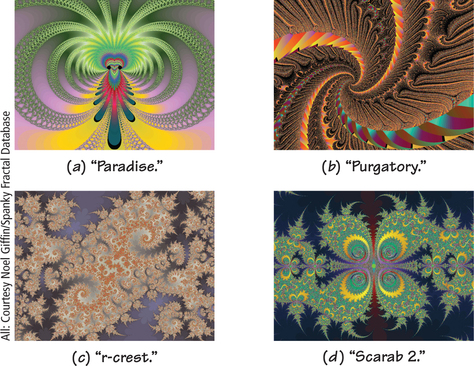
We show various fractals in Figure 19.17. Figure 19.17a looks to us like an orchid with pronounced “bee guides” to the pollen. With its vertical mirror line, the overall pattern has rosette symmetry. However, the basic motif of the lacy wings is repeated at an infinite number of scales. In Figure 19.17b, the “suckers” on the “tentacles” appear in smaller and smaller sizes as the tentacles wind their way toward the point at the center. The pattern in Figure 19.17c has overall rosette symmetry of type , but the “seahorse” motif, with two large seahorses foot-to-foot in the center, is repeated in diminishing sizes throughout. Figure 19.17d features (to our imagination) “spiky snowmen,” with smaller ones growing out of the sides of larger ones. What do they look like to you? And does the overall pattern as a rosette have symmetry or ?
809
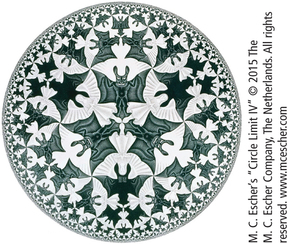
A famous example of a fractal pattern is M. C. Escher’s print Circle Limit IV (Figure 19.18). As you examine the angels and devils closer and closer to the boundary of the circle, you notice that they are not necessarily geometrically similar to the ones at the center. However, if you imagine that the print is the image of a hemisphere, figures farther away from your viewpoint should indeed appear smaller.
Apart from their beauty and the opportunity that they offer as an art form (there is even “fractal music"!), fractals have become a basis for several major applications:
- Fractals with simple rules can mimic very well the structure of a leaf, a shell, a tree, or a mountain (see Figure 19.19).
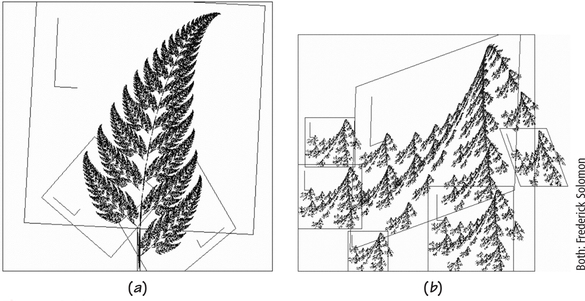
This fact not only allows us to model natural phenomena using fractals but also suggests that they are produced by corresponding simple “rules of nature.” Moreover, computer special effects in films can use fractals to mimic nature very closely, as in Star Trek II: The Wrath of Khan, for landscapes on the Genesis planet, and in Return of the Jedi, for the moons of Endor and the Death Star. In The Perfect Storm, fractals were used to add surface textures and even to scatter light inside water drops.
Figure 19.20 shows how a recursive rule, like the one for forming the Fibonacci numbers, can form a fractal. [This is an example of an iterated function system (IFS), a topic that is discussed in detail in Chapter 23 in connection with mathematical chaos.]
810
- You are likely familiar with graphics in the JPEG compressed format. Similar in efficiency to the JPEG compression algorithm is another method of image compression that is based on fractals. The key idea is to store not the millions of bits that make up an image but instead a much smaller number (maybe thousands) of rules for generating patterns that can be found in the image. A simple example (which doesn’t use fractals) is that you can compress a checkerboard of a million pixels that alternate between black and white to just two simple rules: If the current pixel is white, the next one is black, and if the current one is black, the next one is white. A more realistic example was Microsoft’s Encarta Encyclopedia. It contained thousands of articles and photographs, plus color animations and hundreds of maps—all on one CD-ROM, thanks to fractal data compression. Fractal compression has been used for downloading satellite imagery. Although decoding a fractally compressed image is fast, the coding step is not, so fractal compression has not been applied with success to video compression.
- Antennas in a fractal shape are used in cellphone applications. Such a shape maximizes the effective length of the antenna for the space that it takes up; it also allows the antenna to operate well at a range of frequencies.
Symmetry in Chaos
While the patterns in rosettes, strips, wallpaper patterns, and some fractals can be produced from very simple rules for the symmetries involved, you may be surprised to learn that symmetry can also arise from apparently random behavior.
We think of symmetry as referring to order, and chaos to disorder and randomness. Scientists use the word chaos in a technical sense to describe systems whose behavior over time is inherently unpredictable. We explore chaotic systems in Chapter 23 (Section 23.5 on page 971). Here, we investigate how chaos can produce astonishingly beautiful designs on a computer screen.
811
One way to produce a graphic is to start with an initial pixel on the screen, apply a mathematical function (formula) to its coordinates to generate coordinates of a new pixel, light up the new pixel, then repeat the process with the new pixel— in other words, iterate recursively.
Iterate the process a large number of times—millions or even hundreds of millions of times. Since the screen has many fewer pixels than that, by what mathematicians call the pigeonhole principle, some pixels must be visited more than once—maybe even thousands of times.
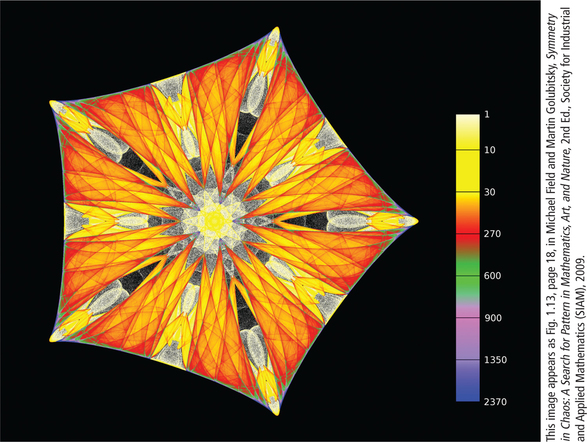
The clue to producing art from this process is “color by number": Choose the color for each pixel according to how many times it is visited, and choose the colors with an eye toward beauty. Figure 19.21 shows an example with symmetry that was produced by 30 million iterations. The scale on the right in Figure 19.21 shows the colors for the number of times that pixels were hit; unhit pixels stay black. The order in which pixels are visited appears to be completely chaotic and is irrelevant to the final image.
- If you ignore the first thousand or so pixels visited, it doesn’t matter what pixel you start from—you get the same image! But the pixels are visited in different orders.
- The formulas are variations on the logistic map, which we discuss in Chapter 23 in connection with biological populations.
812