23.5 23.4 Harvesting Renewable Resources
A renewable natural resource is a resource that tends to replenish itself, such as fish, wildlife, and forests. How much can we harvest and still allow for the resource to replenish itself?
Renewable Resource DEFINITION
A renewable resource is one that tends to replenish itself.
Other renewable resources are biological populations. We concentrate on the subpopulation with commercial value. For a forest, this might be trees of a commercially useful species and appropriate size. We measure the population size in terms of its biomass, the physical mass of the population. For example, we measure a fish population in pounds rather than in number of fish, and a forest not by counting the trees but by estimating the number of board feet of usable timber.
Reproduction Curves
Algebra Review Appendix
Function Notation
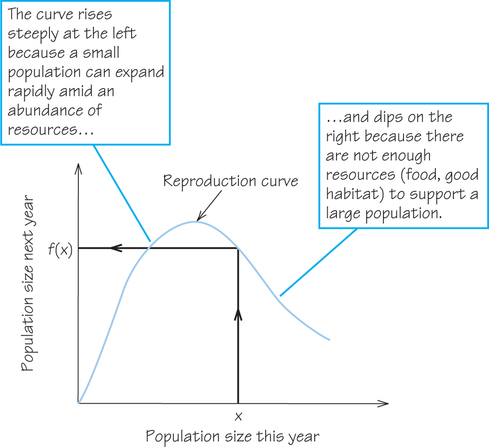
Our models for growth include many simplifications. Complicated factors that can affect populations, such as climatic or economic change, may mean that the only way to understand a population is to plot a graph of its size over time. Either from data, a model, or both, we can construct a reproduction curve to predict next year’s likely population size (biomass) based on this year’s size. Although the precise shape of the curve varies from one population to another, the shape in Figure 23.8 is typical. For all possible sizes, it shows the size this year (on the horizontal axis) and the size next year (on the vertical axis), taking into account the growth in size of continuing members and addition of new members, minus losses due to death and other factors.
961
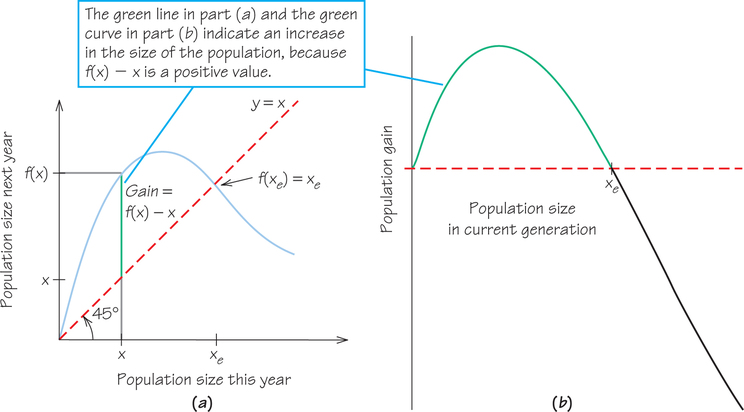
Let on the horizontal axis be a typical size of the population in the current year. The size next year is given by the height of the curve above the point marked . This value is denoted by . (You can think of as standing for “function of,” or even as “forthcoming.”) Figure 23.9a shows the reproduction curve, plus the line of exact replacement: the broken line (which makes a angle with the horizontal axis) that corresponds to the population next year being exactly the same as this year’s. You can trace what happens for various choices for . For an for which the curve is above the broken line, next year’s size, , is larger than this year’s, .
In Figure 23.9b, the natural increase, or gain in population size, is shown as the length of the green vertical line from the broken line to the curve, which in algebraic terms is . For an for which the curve is below the broken line, next year’s size is smaller than this year’s and is negative. For the size labeled , for which the curve crosses the broken line, the size is the same next year as it was this year. This is the equilibrium population size. (Zero is also an equilibrium size for the population, but not one that we are interested in attaining!)
Equilibrium Population Size DEFINITION
An equilibrium population size is one that does not change from one year to the next.
962
Sustainable-Yield Harvesting
For fishing, the yield (harvest) depends on both the population of fish and the amount of fishing effort (number of boats, hours of fishing).
We model a fishery whose goal is to harvest the same yield every year on a sustainable basis. A more sophisticated model could take into account fishing effort (number of boats, number of days out) and adjust the harvest accordingly. However, the simpler model will bring out the main features about sustainable yield. Also, a policy of a fixed harvest limit is easier for authorities to enforce than trying to estimate how many fish are out there.
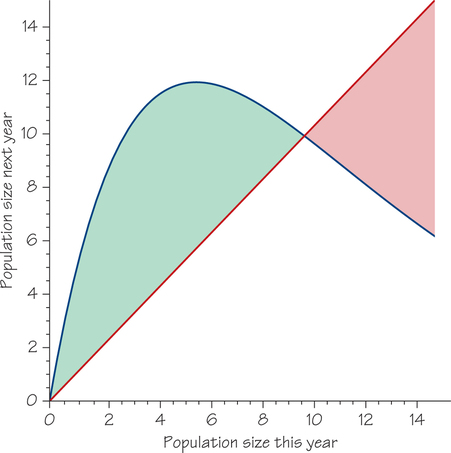
Before we consider the harvest, in Figure 23.10 we take another look at the reproduction curve and the line of exact replacement, this time with numbers involved. The green area corresponds to situations for which there will be more fish next year than this year, and the red area denotes fewer fish next year. The point between the two areas is the natural equilibrium: 10 million tons of fish this year reproduce to give 10 million tons next year.
How much fish could we harvest on a sustainable basis? For a sustainable harvest, we harvest all of the gain and bring the population back to the same level as before the current season’s growth, from which the population should generate the same gain next year. For a sustainable yield, the same amount is harvested every year and the population remaining after each year’s harvest is the same. To achieve this stability, the harvest must exactly equal the natural increase each year, the length of the green vertical line in Figure 23.9a.
963
Sustainable-Yield Harvesting Policy DEFINITION
A sustainable-yield harvesting policy is a policy that would maintain the same yield if continued indefinitely.
Let’s try out a few possible fish harvests.
EXAMPLE 8 Harvest Strategies
What are the consequences of some harvest strategies?
- Suppose that we harvest 4 million tons of fish out of the 10 available this year and leave 6 million tons. That means we leave 6 million as the now remaining population this year to reproduce for next year. We follow up from 6 on the horizontal axis to the blue curve and find that next year the population will be 12 million. Next year we could then harvest 6 million [the distance between the reproduction curve (blue) and the line of exact replacement (red)] and again leave 6 million. We could then continue that pattern indefinitely, for a sustainable catch of 6 million tons.
- Suppose that we are greedier and take 8 million tons of fish this year out of the 10 million available, leaving 2 million tons. We are lucky—those 2 million will reproduce to 8 million. But we can’t take 8 million tons next year, or we would wipe out the population. However, if next year we take 6 million, we would again be leaving 2 million. We could then continue that pattern indefinitely, for a sustainable catch of 6 million tons.
Self Check 8
Describe what happens in the next several years if we constantly harvest 6 million tons of fish.
- The populations over the next years are 10 (this year), minus harvest of 6, leaving 4; 7.5, minus harvest of 6, leaving 1.5; 5, minus harvest of 6, resulting in extinction.
Both of the scenarios in the example yield (after the first year) a sustainable 6 million tons. Which is better for the stock of fish? Surely, we would be better off to leave 6 million in the sea rather than 2 million. After all, our simplistic model is not allowing for chance events (bad weather, changed ocean currents, etc.) that might not allow as much reproduction as our reproduction curve estimates. And there would always be the temptation to take still more of the 6 million.
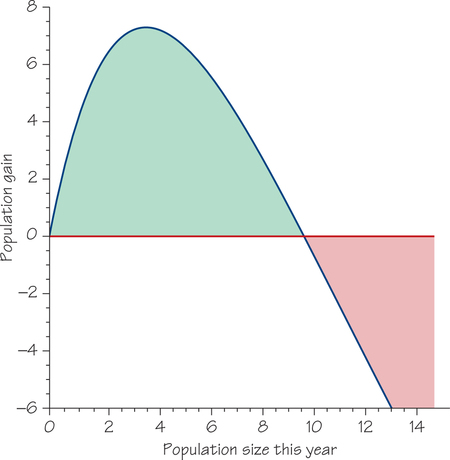
Is 6 million tons of fish the best we could do for a sustainable harvest? Figure 23.11 on the next page shows the population gain for each level of population left this year to reproduce. From that, you can see that a maximum sustainable yield (harvest) of a little over 7 million tons is possible, together with each year leaving 4 million tons to reproduce.
How much fish can be harvested “safely” and on a sustainable basis depends on knowing where we are on the population gain curve. But that curve is difficult to determine, as is estimating how many fish are out there. Moreover, the curve is an ideal that varies with changes in the weather, the environment, and other fish populations. Finally, we will see that not just environmental factors but other ones—plus the possible involvement of mathematical chaos—also come into play.
964
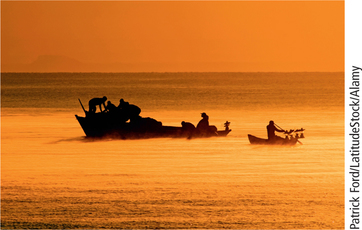
In reality, a successful fishery attracts more fishers and more boats. A result may be more fish, at greater expenditure of overall effort, but then a lower price for fish. As a result, fishers have to fish more hours to maintain incomes, meaning more pressure on the fishery. Either cooperation among the fishers (as in Alaska’s Bristol Bay) or government regulation (as for lobsters off the Maine coast) may be needed to avoid overexploitation and possible extinction of the resource (see Spotlight 23.4).
Dynamics of a Population over Time
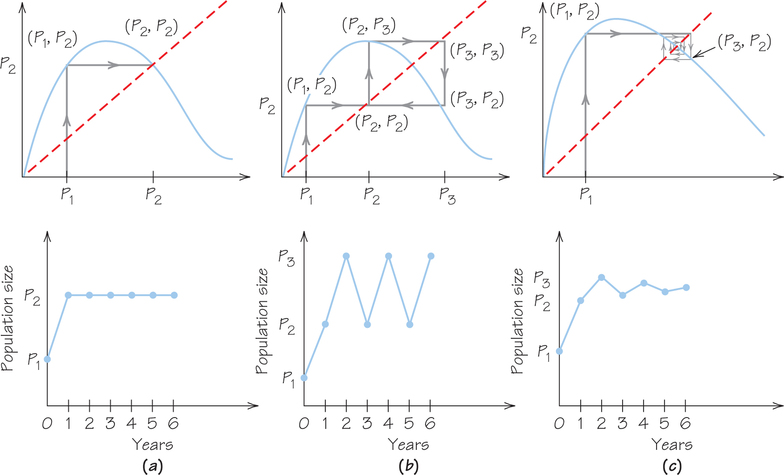
The line provides a convenient way to trace the evolution of the population over several years (see Figure 23.12a), by alternating steps vertically to the curve and horizontally to the line . Begin with the first year’s population on the horizontal axis and go up vertically to the curve. The height is the population in the second year. Proceed horizontally from the curve over to the line . Proceeding vertically from there to the curve yields a height that is the population in the third year. The result is a cobweb diagram, so-called because it resembles a spiderweb. A cobweb diagram gives a convenient visual representation of the evolution of the population over time.
965
Fishing: Out to Sea? Spotlight 23.4
Natural resources are the heritage of all humans, and societies should take steps to maintain that heritage for future generations. Major tools for doing so in connection with hunting and fishing of public resources are limits on harvests: seasonal (when), catch (how much), and size/length (what).
The goal of such limits is to regulate the harvesting in a sustainable way, leaving enough of the resource unharvested to allow for reproduction. Size/ length limits, in particular, are aimed at avoiding harvesting of immature members of the population, so that they can grow to maturity and reproduce (and be harvested later when they are larger). Such limits are imposed in both commercial fishing [e.g., Maine lobsters, which must be at least 3.25 in. (83 mm) from eye socket to end of carapace] and sport fishing [e.g., muskellunge fish ("muskies") in Wisconsin must be at least 40 in. long]. In the ocean, trawlers must have nets that allow smaller fish to escape.
Such selective harvesting has major effects:
- As you might expect, the average size and the average age of fish in the sea both decrease. This is called an age truncation effect.
- The average size of fish caught also decreases. The “big ones” that didn’t get away just aren’t as big as they used to be, as attested by photos of trophy fish caught in Florida in the 1950s compared to those caught today. This result, too, is expected, both because of increased fishing over time and because the fish tend to be harvested as soon as they reach minimum size rather than having the opportunity to grow larger.
- The age of maturation of the fish decreases, which in turn has the paradoxical effect of increasing the growth rate of the population. Scientists have observed this phenomenon also in natural predator- prey relationships:
- o With little fishing in the Mediterranean during World War I, comparison of data for fish harvests before, during, and after the war shows that catching equal percentages of both sharks and their prey at a constant rate raises the population of the prey.
- In his video Earth: A New Wild: Oceans (2015), conservation scientist M. Sanjayan is shown swimming amidst absolutely immense numbers of sharks at the Palmyra Atoll in the Pacific—so many that “all the little fish in the ocean around here have to be reproducing fast in order to feed all these hungry mouths…. So everything is forced to reproduce younger.”
- Though an increase in the reproduction rate is good for the population, less obvious is that age truncation also increases variability and instability in the dynamics of the fish population. The dynamics are nonlinear, meaning that an effect can be out of proportion to its cause, so there is potential for chaos (see Section 23.5). Age truncation creates greater potential for booms and busts, and such wild fluctuations can result in systematic and permanent decline in fish levels.
Nevertheless, it is not selective harvesting but overharvesting that has endangered (and even eliminated) stocks of wild fish and animals. Economic circumstances, including increases in population, can bring pressure to bear on conservation decisions. In particular, lifting a fishing ban when the total stock of fish has recovered—but the age stratification has not—carries risk to the resource and to the livelihoods of those who depend on it.
966
Figure 23.12 shows several traces for the same reproduction curve, each starting from a different initial population on the horizontal axis. The resulting variation is surprising and can be “chaotic” in a very specific mathematical sense, showing how apparently random behavior can result from strict rules.
We consider two models: one for a cattle ranch and one that can apply to either a fishing boat or a tree farm.
We assume that the price received is the same for each harvested unit and does not depend on the size of our harvest. In effect, we assume that our operation is a small part of the total market, not substantially affecting overall supply and hence price.
We want to stay in business, so we do not extinguish the resource for quick profits. For any given population size, we harvest just the natural increase.
EXAMPLE 9 Cattle Ranching
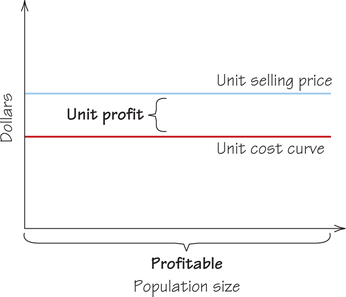
We assume that the cost of raising and taking a steer to market is the same for every steer and does not depend on how many steers we take to market. What should our sustainable-yield harvesting policy be?
Because the cost does not depend on the population size, the cost curve is a horizontal line (Figure 23.13). As long as the selling price per unit is higher than the harvest cost per unit, we make a profit. The points of view of economics and biology agree, because the maximum profit occurs for the maximum sustainable yield.
967
EXAMPLE 10 Fishing and Logging
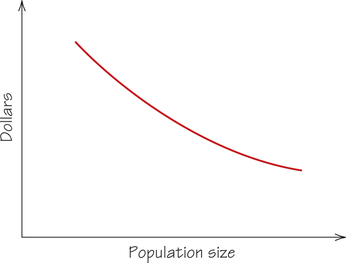
In this model, we assume that the cost of harvesting a unit of the population decreases as the size of the population increases. This is the familiar principle of economy of scale. For example, the same fishing effort yields more fish when fish are more abundant. Similarly, a logger’s harvest costs per tree are less when the trees are clumped together. This is the logger’s motivation to clear-cut large stands. What would a sustainable-yield harvesting policy be?
The cost curve slopes downward and to the right, as in Figure 23.14. The size of the population from which 1 unit is harvested is shown on the horizontal axis. The (average) cost of harvesting a single unit is measured on the vertical axis.
An optimal sustainable-yield harvesting policy depends on the relation between price and costs. There are two cases, as shown in Figure 23.15 on the next page, for a fixed price level.
968
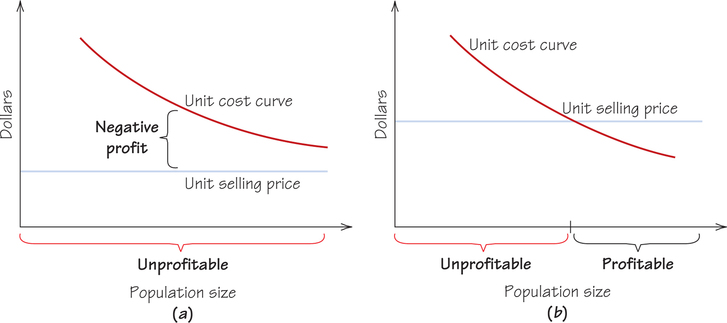
- The unit cost curve lies entirely above the unit price line (Figure 23.15a). The revenue received for a harvested unit is less than the cost of harvesting it, no matter how large the population. It is impossible to make a profit.
- The unit cost curve intersects the unit price line (Figure 23.15b). Above a certain population size, the price for a harvested unit is more than the cost of harvesting it, so profit is possible. Some population size, the economically optimal harvest, gives a maximum net profit. That harvest is lower than the maximum sustainable yield but leaves a greater number to reproduce for next year.
Using calculus, it can be shown that is actually larger than , the population that gives the maximum sustainable yield (see Figure 23.16).
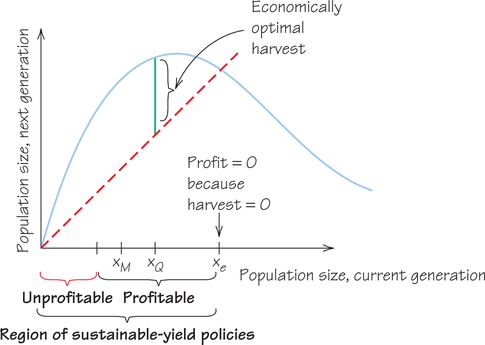
Compared to harvesting the maximum sustainable yield, economic considerations result in harvesting less, but also in maintaining a larger stock of the population. This consequence may seem paradoxical, but the simple reason is that it is cheaper—it takes less effort—to catch fish when there are more of them out there.
969
Why Eliminate a Renewable Resource?
Our simple models fail to take into account a very critical feature of a modern economy: the time value of money, as measured by the interest that capital can earn. We now investigate how the time value of money makes biological populations susceptible to overexploitation and even extinction.
Some species, such as the passenger pigeon, were harvested to extinction. In other cases, an entire ecosystem has been destroyed (see Spotlight 23.5). Why would anyone eliminate a renewable resource? Our approach helps explain why.
The Tragedy of Easter Island Spotlight 23.5
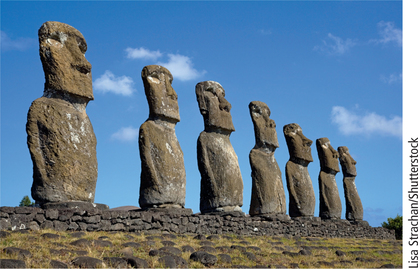
Easter Island is famous for its isolation—it is 1400 miles from the nearest island—and for its hundreds of huge stone statues. For 30,000 years before the arrival of people in about 400, Easter Island maintained a lush forest, with several species of land birds. By the time of the first visit by Europeans in 1722, the island was barren—denuded of all trees and bushes over 10 feet high, and with no native animals larger than an insect. The 2000 or so islanders had only three or four leaky canoes made of small pieces of wood.
What happened? Careful analysis of pollen in soil samples tells the sad story. The settlers and their descendants cut wood to plant gardens, build canoes, make sledges and rollers to move the huge statues, and burn for cooking and warmth in the winter. In addition to crops that they raised and chickens that they brought to the island and cultivated, they ate palm fruit, fish, shellfish, the meat and eggs of birds, and the meat of porpoises that they hunted from seagoing canoes. The population of the island grew to 7000 (or perhaps even 20,000).
By 1500, the forest was gone. Most tree species, all land birds, half the seabirds, and all large- and medium-sized shellfish had been extinguished. There was no firewood, no wood for sledges and rollers to transport hundreds of statues at various stages of completion, and no wood for seaworthy canoes. Without canoes, fishing declined and porpoises could not be taken. Stripping the trees exposed the soil, which eroded, so crop yields fell. The people continued raising chickens, but warfare and cannibalism ensued. By 1700, the population had shrunk to 10% to 25% of its former size.
Why didn’t the people notice earlier what was happening, imagine the consequences of keeping on as they had been, and act to avert catastrophe? After all, the trees did not disappear overnight.
From one year to the next, changes may not have been very noticeable. The forests may have been regarded as communal property, with no one charged with limiting exploitation or ensuring new growth. There was no quantitative assessment of the resources available and the need for conservation versus the longterm needs of the “public works” program of erecting statues. Moreover, the religion of the people, the prestige of the chiefs, and the livelihood of hundreds depended on the statue industry. There was no perceived need to limit the population and no technology for birth control.
once the large trees were gone, there was no means for excess population to emigrate.
Information from Jared Diamond, “Easter’s end,” Discover, 16(8) (August 1995): 63–69.
970
Sustainable-yield policies involve revenues that will be received, year after year, in the future. The value of these revenues is discounted to reflect the lost investment income that we could earn if instead we had the revenues today. For funds invested at a return of per year, compounded annually, the present value of an amount to be received in years in the future is related to by the compound interest formula .
The economic goal is to maximize the sum of the present values of all future receipts from harvesting. The optimal harvesting policy thus must depend on the expected rate of return . We don’t delve into the details of the calculations here, but instead just give the results of the analysis.
Again, there are several cases to consider:
- The unit cost of harvesting exceeds the unit price received for all population sizes. Then it is impossible to make a profit.
- For small : For some population size , the unit cost of harvesting equals the unit price received. Then there is a size between and (the equilibrium population size) for which the present value of the total return is maximized and the population and its yield are sustained. This size may be larger or smaller than , the population that gives the maximum sustainable yield; but for large enough , it will be smaller.
- For larger , the economically optimal policy may be to harvest the entire population, immediately extinguish the resource, and invest the proceeds in something else. The unit price exceeds the unit cost for all population sizes.
Let’s put this in the simplest and starkest terms. Suppose that you own a resource, such as a forest, whose cost of harvesting is small relative to its value. If the rate at which the trees grow is greater than what you can earn on other investments, it pays to let the forest keep on growing.
On the other hand, if the forest grows more slowly than the rate of return on other investments, the economically optimal harvesting policy is to cut down all the trees now and invest the money in some other asset. For example, you could then start raising cattle on the land—and right there you have the scenario that is resulting in deforestation all over the world.
The sobering fact is that very few economically significant renewable resources can sustain annual growth rates over 10%. Many, like whales and most forests, have growth rates in the 4% to 5% range. These values—even a growth rate of 10%—are far below the return that many investors expect on their investment. For example, over the long run, the U.S. stock market has yielded an average 10% annual return, but venture capital firms expect to exceed a 25% annual profit.
The concept of maximum sustainable yield is an attractive ideal if the expectations of investors are low enough. However, there are still difficult problems:
- One problem is the “tragedy of the commons,” discussed by ecologist Garrett Hardin. Several hundred years ago, English shepherds would graze their flocks together on common land. The grass of the commons could support only a fixed number of sheep. Each shepherd could reasonably think that adding just one or two more sheep to his flock would not overtax the commons. Yet if each did so, there could be disaster, with all the sheep starving. Many natural-products industries, such as fisheries, are a form of commons. Small overexploitation by each harvester can produce disastrous results for all. Global warming may be a tragedy of a worldwide commons.
How, in the presence of human needs or greed, can we anticipate and prevent overexploitation and possible extinction of a resource? By and large, it has been politically impossible to force a harvesting industry to reduce current harvests to ensure stability in the future.
971
- In some industries, such as a fishery, growth of the population may be abundant one year but meager another. Moreover, varied harvesting pressure and selectivity can magnify fluctuations in the age structure and the abundance of the resource (see Spotlight 23.4, page 965). So a steady yield can be neither guaranteed nor sustained without some risk of damaging the resource. For example, a few good years in a row may provoke increased investment in fishing capacity; then attempting to harvest at the same levels in succeeding normal or below-normal years results in overfishing. This exact scenario destroyed the California sardine fishery in the 1930s, the Peruvian anchovy fishery in 1972, and much of the North Atlantic fishery in the 1980s. The ocean off northwest Africa was nearly picked clean during the past decade.
Were the fishing fleets and regulators mentioned above at fault for extinguishing these fisheries by overexploiting a dependable resource? Or were the extinctions due to chance variations of the fish stocks? In the next section, we examine a third possibility—that the fish stocks followed simple rules that nevertheless produced “chaotic” behavior of stocks, that is, wide variation from one year to the next. When we do not see the pattern, we interpret such behavior as randomness, much as the moves in a chess game may appear random and inexplicable to someone who does not know the rules of the game.