Self Check Answers
![]() Self Check Answers
Self Check Answers
(a) The individuals are the students.
(b) "Major" is a qualitative variable and "points" is a quantitative variable.
Class 0 26 35 47 50 54 55 59 Frequency 4 1 5 1 1 1 1 1 Class 62 76 77 78 85 92 120 125 Frequency 2 1 1 1 1 1 1 1 Class 137 142 145 157 175 189 215 225 Frequency 1 1 2 1 1 1 1 1 Based on Figure 5.7, only part (c) is guaranteed to be true. The values $16,000 and $18,000 fall within the class interval from $15,000 to $20,000, which contains no data. For part (a), it could be the case that all data values that fell into the first class interval were less than $7500 and all data values that fell into the second class interval were greater than $12,500. This would make part (a) false. The interval from part (b), between $12,500 and $22,500, is wider than the third class interval that contains no data. It is possible that one or more of the data values that fell into the second class interval was between $12,500 and $15,000, which would make part (b) false.
To find the mean:
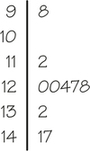
To find the median, order the data from largest to smallest:
98 112 120 120 124 127 128 132 141 147 Since is even, find the median by taking the mean of the middle two observations: . The mode is the value that occurs most frequently. In this case, the value 120 occurs twice while all other values occur only once. Hence, the mode is 120.
21, 26.5, 31, 34, 52
Here are all 10 deviations from the mean:
−1.00 −3.24 −2.14 2.92 −2.92 −1.33 7.68 2.71 −1.91 4.28 −7.95 The sum of the deviations is 0.02, a difference from 0 that can be attributed to rounding the mean to two decimals.
(a)
(b) The squared deviations for the two altered data values are and . The new sum of squared deviations from the mean is 102.088. Hence, . This value is smaller than the standard deviation for the original data.
221
(a) Since this is a triangle, its area is half its base times its height: .
(b) To calculate the proportion, we need to calculate the area of the triangular region under the density curve to the left of 1.5 as shown below.
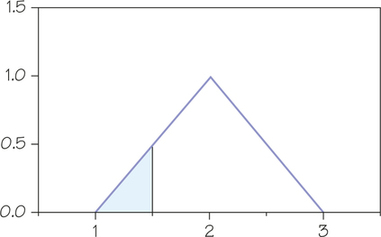
This is a triangular region with base 0.5 and height 0.5. It has area (1/2)(0.5)(0.5) = 0.125.
(a) The solid curve represents the distribution with the larger mean since its center of symmetry is around 30 and the dashed curve’s center of symmetry is around 25.
(b) The dashed curve represents a distribution with the larger standard deviation since it is the flatter of the two density curves.
(a) To be in the bottom 25%, a student’s score must be below the 25th percentile, which is (0.67)(100) = 67 points below the mean. So scores below 433 are in the bottom 25%.
(b) A score of 300 is 2 standard deviations below the mean. Recall that 95% of observations are within 2 standard deviations of the mean, and hence, 5/2 or 2.5% are below 300.