6.3 6.2 Making Predictions: Regression Line
If the overall pattern in a scatterplot is a straight-line relationship, it is useful to summarize this pattern by drawing a line on the scatterplot. A regression line summarizes the relationship between two variables, but only in a specific setting: when one variable helps explain or predict the other. That is, regression describes a relationship between an explanatory variable and a response variable.
Regression Line DEFINITION
A regression line is a straight line that describes how a response variable changes as an explanatory variable changes. A regression line is often used to predict the value of for a given value of .
EXAMPLE 4 Predicting Blood Alcohol Content (BAC)
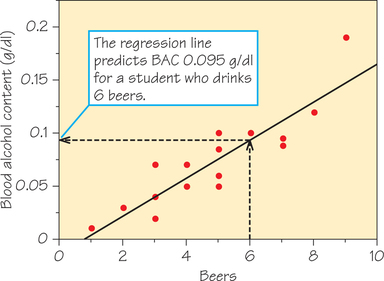
The scatterplot in Figure 6.2 shows a straight-line relationship between how many beers a student drinks and his or her BAC 30 minutes later. Figure 6.6 repeats this scatterplot and adds a regression line that summarizes the pattern of the data. We can use this line to predict BAC for a student based on the number of beers consumed.
Figure 6.6 shows the prediction in graphical form for a student who drinks 6 beers. Start at , go up to the line, and then head left to the y-axis. We hit the y-axis at . This is the BAC that corresponds to 6 beers, according to the regression line. (Recall that the legal limit for driving is 0.08.) The line represents only the overall pattern of the data, so the BAC of a randomly chosen student after 6 beers will probably not be exactly 0.095. But because the points for the 16 students in the Ohio State study are not far from the line, we expect the prediction to be reasonably accurate.
252
However, for a more precise prediction, it is easier to use the equation of the line than to estimate the prediction from the graph. With the application of formulas that will be given in Section 6.4, the equation of the line in Figure 6.6 is
For a student who drinks 6 beers, we have
Because two points determine a unique line, you could plot a line by using its equation to determine any two particular points that lie on that line, plot those points, and then draw the line through them. For example, from the equation
we just determined that one point is (6, 0.095). By plugging in , we could obtain another point. Drawing the line through those two points yields the line in Figure 6.6.
Self Check 3
The equation of the line in Figure 6.6 is
Determine a second point on the line by plugging in for the number of beers. What is that point?
- (2, 0.023) (The second coordinate has been rounded to three decimal places.)
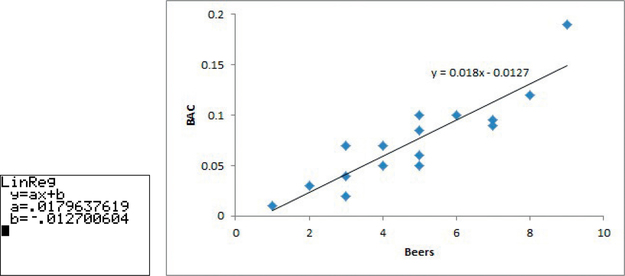
Statistical software and spreadsheets as well as many calculators will give you the equation of a regression line from data that you enter. For example, Figure 6.7 shows the results for calculating the equation of the line in Figure 6.6 using a TI-84 graphing calculator and Excel. (Instructions for calculating the equation can be found in Spotlight 6.5 on page 265.)
You should know how to use a regression line even if you don’t look into the details needed to calculate the line from data. First, recall some basic facts about the coefficients (slope and intercept) in the equation of a line.
253
Equation of a Regression Line DEFINITION
Suppose that is a response variable (plotted on the vertical axis) and is an explanatory variable (plotted on the horizontal axis). If we call the predicted value of , then the resulting regression line for predicting from has an equation of the form1
In this equation, is the slope, which is the amount by which changes when increases by 1 unit. The number is the -intercept, which is the value of when (i.e., when the line intercepts the y-axis).
Algebra Review Appendix
Slope of a Line Graphing a Line in Slope-Intercept Form
EXAMPLE 5 Interpreting the Slope of a Regression Line
The slope of the line in Example 4 is . This says that as we move to the right along the line, predicted BAC goes up by 0.01796 for each additional beer that a student drinks. So, if a student has 3 additional beers, the BAC would increase by . The slope tells us how quickly changes as we change , which is important for understanding the pattern in the data. The slope is positive () when there is a positive association between the variables, as there is between BAC and beers consumed. It is negative when there is a negative association.
You might think that because the slope is small that , beers consumed, has little influence on , BAC. Unfortunately, the size of a slope is affected by the units in which we measure the two variables. In Table 6.1, BAC is measured in grams of alcohol per deciliter (g/dl) of blood. That is, when the number of beers consumed increases by 1, the alcohol in a deciliter of blood increases by 0.01796 grams. There are 1000 milligrams in a gram. So, if we changed the BAC units to milligrams of alcohol per deciliter (mg/dl) of blood, the slope would be 1000 times as large: . You can’t say how important a relationship is just by looking at how big the slope is.
Self Check 4
A study was conducted to see whether women’s total cholesterol [in milligrams per deciliter (mg/dL)] is related to age. A scatterplot of the data indicated a straight-line relationship, described by the following equation:
Interpret the slope of the regression line in the context of this study.
- For each additional year of age, cholesterol increases by 1.64 mg/dl.
254
Although it is generally useful to interpret the slope of a regression line, that is not the case for the y-intercept. Mathematically, the y-intercept is the predicted value of when . The y-intercept of the regression line in Example 4 is . Although we need the value of the intercept to draw the line, it is statistically meaningful only when can actually take values close to zero. Even then, you should think of the intercept as describing the line rather than taking it seriously as a prediction. In this situation, if a student drinks no beers, , then the predicted value of his or her BAC is , which is clearly impossible (but is at least close to 0, the value we would expect for a student’s BAC if he or she consumed 0 beers).