Skills Check
![]() Skills Check
Skills Check
Question 6.1
1. You have data for many families about the parents’ income and the years of education that their eldest child completes. When you make a scatterplot, the explanatory variable on the x-axis
- is the parents’ income.
- is years of education.
- doesn’t matter.
1.
a
Question 6.2
2. The outcome or result of a study is measured by a(n)__________ variable.
2.
response
Question 6.3
3. The data in Example 1 (page 243) consist of
- 16 ordered pairs of values.
- 2 unpaired sets of values, each of which has 16 values.
- 32 ordered pairs of values.
3.
a
Question 6.4
4. The explanatory variable is plotted on the ___ axis of a scatterplot.
4.
or horizontal
Question 6.5
5. If two variables have a negative association, an increase in one variable tends to accompany ________ in the other variable.
- an increase
- a decrease
- no change
5.
b
Question 6.6
6. You expect to see a _________ association between the parents’ income and the years of education that their oldest child completes.
6.
positive
Question 6.7
7. A high school teacher was curious whether the SAT Math test score was a good predictor of students’ SAT Critical Reading test score. To find out, he collected SAT data from 15 graduating seniors. Figure 6.20 is a scatterplot of SAT Critical Reading test scores against the SAT Math test scores of these 15 students.
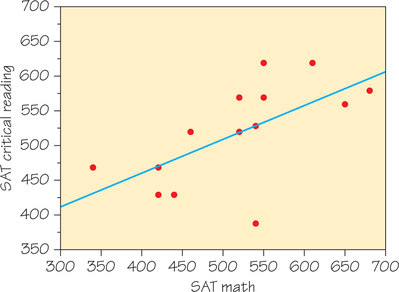
There is one low outlier in the plot. The SAT Critical Reading and Math scores for this student are
- , .
- , .
- , .
7.
c
Question 6.8
8. The line in Figure 6.20 is a regression line for predicting the SAT Critical Reading score from the SAT Math score. If another senior from this school has an SAT Math score of 600, then which of the following choices would you predict for the student’s SAT Critical Reading score?
- 510
- 560
- 580
8.
b
276
Question 6.9
9. The slope of the line in Figure 6.20 is closest to
- 2.
- 1.
- 1/2.
9.
c
Question 6.10
10. The points on a scatterplot lie close to the line whose equation is . The slope of this line is _____________.
10.
−5
Question 6.11
11. Starting with a fresh bar of soap, you weigh the bar each day after you take a shower. Then you find the regression line for predicting the weight from the number of days elapsed. The slope of this line will be
- positive.
- negative.
- You can’t tell without seeing the data.
11.
b
Question 6.12
12. Fred keeps his savings in his mattress. He began with $500 from his mother and adds $100 each year. In the form , the equation for his total savings after years would be __________.
12.
Question 6.13
13. The amount of water discharged by the Mississippi River has changed over time in roughly a straight-line pattern. A regression line for predicting water discharged (in cubic kilometers) during a given year is
How much (on average) does the volume of water increase with each passing year?
- −7792 cubic kilometers
- 4.226 cubic kilometers
- 7792 cubic kilometers
13.
b
Question 6.14
14. According to the regression line in Skills Check 13, the predicted Mississippi River discharge in the year 2016 will be _________ cubic kilometers.
14.
727.6
Question 6.15
15. You have data on the body weight and brain weight for many species of mammals. Body weight is given in kilograms, and brain weight is given in grams. There are 1000 grams in a kilogram. The slope of the regression line for predicting from is . If brain weight were given in kilograms, the slope would
- change to 0.0014.
- still be 1.4.
- change to 1400.
15.
a
Question 6.16
16. Suppose , where and are measured in meters. If is re-expressed in centimeters instead, the equation becomes _____________.
16.
Question 6.17
17. Given the following set of five ordered pairs, the correlation equals what?
| 0 | 1 | 2 | 3 | 4 | |
| 2 | 3 | 5 | 6 | 14 |
- 0.3
- 0.6
- 0.9
17.
c
Question 6.18
18. The correlation between brain weight and body weight in Exercise 15 is . If brain weight had been measured in kilograms rather than grams, the correlation would have a value of ____________.
18.
the same:
Question 6.19
19. The points on a scatterplot lie very close to the line whose equation is . The correlation between and is close to which of the following values?
- −3
- −1
- 1
19.
b
Question 6.20
20. High coffee prices give farmers in Indonesia an incentive to cut forest in order to plant more coffee. Here are data on coffee price (dollars per pound) and percentage of deforestation in a national park for five years:
| 0.29 | 0.40 | 0.54 | 0.55 | 0.72 | |
| 0.49 | 1.59 | 1.69 | 1.82 | 2.98 |
Using a calculator, we can determine that the correlation between and has a value of _________, to the nearer hundredths place.
20.
Question 6.21
21. Return to the data in Skills Check 20. Using a calculator, find the standard deviations of the coffee prices () and percentages of deforestation (). Use these standard deviations and your answer to Skills Check 20 to calculate the slope of the least-squares regression line. Round the slope to one decimal place.
21.
Question 6.22
22. Using Table 6.1 (page 243) and the prediction equation in Example 4 (page 251), what is the residual error for Student 4?
- −0.01
- 0.01
- 0.13
22.
a
Question 6.23
23. In the least-squares method, what is it that is being squared?
- Each observed value
- The vertical distance of each data point from the line
- The sum of the vertical distances of the data points from the line
23.
b
277
Question 6.24
24. Putting the symbol ^ (i.e., a caret or circumflex) over indicates that this is the ___________ value of .
24.
predicted (or estimated or fitted)
Question 6.25
25. If the slope and correlation value are equal, then the standard deviation of must equal
- l.
- the slope.
- the standard deviation of .
25.
c
Question 6.26
26. If the residual error is positive, the observed response lies __________ the line.
26.
above
Question 6.27
27. There is a strong positive correlation between the number of firefighters at a fire and the amount of damage the fire causes. The reason for this is that
- more firefighters cause more damage at the fire scene.
- bigger fires require more firefighters and also do more damage.
- more damage requires more firefighters to clean it up.
27.
b
Question 6.28
28. Making predictions well beyond the data collected is called ___________.
28.
extrapolation
Question 6.29
29. Make a scatterplot with the six ordered pairs in the table below. Of the first three ordered pairs listed in the table, the one that, if deleted, would cause the biggest change in the value of the correlation is
- (0, 0).
- (8, 3).
- (2, 4).
| Ordered pair number | 1 | 2 | 3 | 4 | 5 | 6 |
| 0 | 8 | 2 | 0 | 1 | 1 | |
| 0 | 3 | 4 | 1 | 1 | 0 |
29.
c
Question 6.30
30. Association (correlation) does not imply that changes in ____________ changes in .
30.
cause
Question 6.31
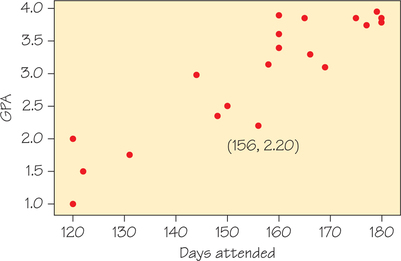
31. A high school teacher conducted a small study on school achievement. For a group of 20 of her juniors, she recorded the number of days the students attended school in their junior year and their grade point average at the end of the year. A scatterplot of her data appears in Figure 6.21. Would you describe the relationship between GPA and Days Attended as positive, negative, or neither? Briefly explain.
31.
It's a positive association; as number of days attended increases, GPA tends to increase.
Question 6.32
32. The correlation between Days Attended and GPA is . Would you classify the relationship shown in Figure 6.21 as weak, moderate, or strong?
32.
Strong
Question 6.33
33. The teacher fit a least-squares regression line to the data displayed in Figure 6.21. Given the following summary statistics, determine the equation of this line:
33.
Question 6.34
34. The ordered pair (156, 2.20) is marked on the scatterplot in Figure 6.21. Use your equation of the least-squares regression line from Skills Check 33 to determine the residual error for this point.
34.
Question 6.35
35. Use the equation of the least-squares regression line you calculated in Skills Check 33 to predict the GPA of a student who attended school on only 60 days. Does your answer make sense? Is this an example of extrapolation or interpolation?
35.
Predicted . It does not make sense to have a negative GPA. This example shows the danger of extrapolation.