Chapter 7 Exercises
Chapter 7 Exercises
7.1 Sampling
Question 7.31
1. A Gallup poll asked, “How would you describe your own personal weight situation right now?” Thirty-eight percent of American adults answered “very/somewhat overweight.” Gallup reported that these results were based on telephone interviews of 1021 adults conducted on November 4–7, 2010.
- What was the population for this sample survey?
- What was the sample size?
1.
(a) U.S. adults
(b) The 1021 who responded
329
Question 7.32
2. Starting with the 2010 Census, the decennial “long form” sample was replaced with the annual American Community Survey (ACS; www.census.gov/acs/). The main part of the ACS contacts 250,000 households by mail each month, with follow-up by phone and in person if there is no response. Each household answers questions about its housing, economic, and social status. What is the population for the ACS?
Question 7.33
![]() 3. On the Hudson Valley, New York, Patch Facebook page, readers were asked to send in stories of awful Valentine’s Day gifts. The following were selected:
3. On the Hudson Valley, New York, Patch Facebook page, readers were asked to send in stories of awful Valentine’s Day gifts. The following were selected:
- Leftover chocolate (and he had eaten one!)
- Flowers purchased the day before Valentine’s because it was cheaper to buy them the day before
- A recycled card from an ex-boyfriend with an open box of chocolates
Readers were then asked to vote on the best “worst Valentine’s Day gift ever” story.
- Describe the population.
- Describe the sample.
- Do you think the response to this poll is representative of the views of the residents of the Hudson Valley, New York? Explain.
3.
(a) The population would be all the Hudson Valley Patch Facebook readers or it could be all residents of the Hudson Valley region in New York State. [If the latter, the sample in part (b) will miss all of the non-Facebook readers in Hudson Valley.]
The sample would be the readers who went to the Facebook page and voted for the worst Valentine’s Day gift.
(c) No. First, not all Hudson Valley residents are on Facebook with the Hudson Valley Patch. In particular, the votes do not represent the opinions of non-Facebook users.
7.2 Bad Sampling Methods
Question 7.34
![]() 4. You see a student standing in front of the Student Center, stopping other students now and then to ask them questions. The student says that she is collecting student opinions for a class assignment. Explain why this sampling method is almost certainly biased.
4. You see a student standing in front of the Student Center, stopping other students now and then to ask them questions. The student says that she is collecting student opinions for a class assignment. Explain why this sampling method is almost certainly biased.
Question 7.35
![]() 5. A member of Congress is interested in whether her constituents favor a proposed gun-control bill. Her staff reports that letters on the bill have been received from 361 constituents and that 323 of these oppose the bill. What is the population of interest? What is the sample? Is this sample likely to represent the population well? Explain your answer.
5. A member of Congress is interested in whether her constituents favor a proposed gun-control bill. Her staff reports that letters on the bill have been received from 361 constituents and that 323 of these oppose the bill. What is the population of interest? What is the sample? Is this sample likely to represent the population well? Explain your answer.
5.
Population: “constituents,” probably voters living in her district. Sample: the 361 who wrote letters. Those who wrote probably feel strongly about gun control and may not represent all constituents (voluntary response).
Question 7.36
![]() 6. Highway planners made a main street in a college town one-way. Local businesses were against the change. The local newspaper invited readers to call a telephone number to record their comments. The next day, the paper reported:
6. Highway planners made a main street in a college town one-way. Local businesses were against the change. The local newspaper invited readers to call a telephone number to record their comments. The next day, the paper reported:
Readers overwhelmingly prefer two-way traffic flow to one-way streets. By a 6:1 ratio, callers to the newspaper’s Express Yourself opinion line on Wednesday complained about the one-way streets that have been in place since May. Of the 98 comments received, all but 14 said “no” to one-way streets.
- What population do you think the newspaper wants information about?
- Is the proportion of this population who favor one-way streets almost certainly larger or smaller than the proportion in the sample? Why?
Question 7.37
![]() 7. Your college wants to gather student opinion about a proposed student fee increase. It isn’t practical to contact all students.
7. Your college wants to gather student opinion about a proposed student fee increase. It isn’t practical to contact all students.
- Give an example of a way to choose a sample of students that is poor practice because it depends on voluntary response.
- Give an example of a bad way to choose a sample that doesn’t use voluntary response.
7.
Sample response: (a) Print a coupon in the campus newspaper asking students to check their opinion, cut out the coupon, and mail it in.
(b) Ask all the students in a large sociology course to record their opinion before giving an exam in the course. (This is a convenience sample.)
Question 7.38
![]() 8. Explain why each of the following samples might be biased:
8. Explain why each of the following samples might be biased:
- A large university wants to conduct a focus group on campus satisfaction. A poster was hung in the Student Union inviting students to participate (with a promise of free food!).
- The president of the United States wants to check his approval rating after two years in office. A sample of 1000 voters is selected from California.
7.3 Simple Random Samples
Question 7.39
9. You have just been blessed with quadruplets (all girls). You decide to select their names using an SRS of four names from the following list of the most popular names given to American girls born in the past decade. To do this, use Table 7.1 (page 298), starting at line 122.
| 1. Emily | 6. Abigail | 11. Alexis | 16. Brianna |
| 2. Madison | 7. isabella | 12. Sarah | 17. Lauren |
| 3. Emma | 8. Samantha | 13. Sophia | 18. Chloe |
| 4. Olivia | 9. Elizabeth | 14. Alyssa | 19. Natalie |
| 5. Hannah | 10. Ashley | 15. Grace | 20. Kayla |
9.
Selected labels: 13, 15, 05, and 09. These labels correspond to the names Sophia, Grace, Hannah, and Elizabeth.
Question 7.40
10.
- Would pulling out and lining up several dollar bills to use the eight-digit serial numbers be a reasonable substitute for Table 7.1? Explain.
- How about using the telephone numbers on a page of the phone book? Explain.
Question 7.41
11. There are approximately 371 active three-digit telephone area codes covering Canada, the United States, and some Caribbean areas (more are created regularly).
330
You want to choose an SRS of 25 of these area codes for a study of available telephone numbers.
- How would you label the area codes to use Table 7.1?
- Use Table 7.1 (page 298), starting at line 125, to choose the first three labels of the members of this sample.
11.
(a) 001 to 371
(b) Area codes labeled 214, 235, 119
Question 7.42
12. Each March, the Current Population Survey (CPS) is expanded to gather a wider variety of information than what is collected in the monthly reports. Suppose in one March survey, we are interested in participants whose highest level of education is a bachelor’s degree and who are between the ages of 25 and 64. It turns out that 14,959 of the survey respondents fall into this category. Think of them as a population.
- To select an SRS of these people, how would you assign labels?
- Use Table 7.1 (page 298), starting at line 107, to choose the first three members of the SRS.
Question 7.43
![]() 13. In using Table 7.1 repeatedly to choose samples, you should not always choose the same row, such as line 101. Why not?
13. In using Table 7.1 repeatedly to choose samples, you should not always choose the same row, such as line 101. Why not?
13.
If you always start at the same point in the table, your sample is predictable in advance. Repeated samples of the same size from the same population will always be the same—that’s not random.
Question 7.44
![]() 14. Which of the following statements are true of a table of random digits and which are false? Explain your answers.
14. Which of the following statements are true of a table of random digits and which are false? Explain your answers.
- There are exactly four 0s in each row of 40 digits.
- Each pair of digits has chance 1/100 of being 00.
- The digits 0000 can never appear as a group because this pattern is not random.
Question 7.45
15. Your dog just had a litter of 5 male puppies. Picking out good names for dogs can be difficult. On the Internet, you found a list of the top 20 names for male puppies, which are shown below. You decide to randomly select 5 names from the list as names for the puppies. What names did you select? Explain how you randomly selected these names. [Use Excel or a graphing calculator and one of the techniques discussed in Spotlight 7.1 (page 300) for this exercise.]
| Max | Buddy | Charlie | Rocky |
| Cooper | Duke | Bear | Jack |
| Bently | Toby | Zeus | Tucker |
| Diesel | Jake | Milo | Teddy |
| Jax | Buster | Bandit | Harley |
15.
Sample response for TI-84: First, assign labels to the names. The first column on names (Max through Cooper) are assigned labels 1–5; the second column, labels 6–10; the third column, labels 11–15; the fourth column, labels 16–20. Then use a TI-84 calculator and the randIntNoRep command to generate five randomly chosen numbers from the integers 1 to 20 with no repeats. The randomly chosen labels were 8, 7, 16, 15, 17. So, the puppies’ names will be Jack, Bear, Teddy, Milo, and Jax.
Question 7.46
16. The students listed below are enrolled in an elementary French course. Students are assigned to one of two smaller conversation sections at random. [Use Excel or a graphing calculator and one of the techniques discussed in Spotlight 7.1 (page 300) for this exercise.]
| 1. Arnold | 11. Ellis | 21. Martinez | 31. Randall |
| 2. Barrett | 12. Fernandez | 22. Moore | 32. Rodriguez |
| 3. Bartkowski | 13. Flury | 23. Munroe | 33. Schiller |
| 4. Burns | 14. Garcia | 24. Neale | 34. Scott |
| 5. Campbell | 15. Hardy | 25. Nguyen | 35. Smith |
| 6. Chang | 16. Holmes | 26. Oakley | 36. Stevenson |
| 7. Colon | 17. Jones | 27. Orsini | 37. Swokowski |
| 8. Davies | 18. Juarez | 28. Perlman | 38. Taylor |
| 9. Dodington | 19. Kempthorne | 29. Prizzi | 39. Vuong |
| 10. Drummond | 20. Levine | 30. Putnam | 40. Ward |
Choose a simple random sample of 20 of these students to form Section 01. Explain how you obtained the names for this section. The remaining students will be assigned to Section 02.
Question 7.47
![]() 17. The last stage of the CPS uses a systematic sample. An example will illustrate the idea of a systematic sample. Suppose that we must choose 4 rooms out of the 100 rooms in a dormitory. Because , we can think of the list of 100 rooms as 4 lists of 25 rooms each. Choose 1 of the first 25 rooms at random, using Table 7.1 (page 298). The sample will contain this room and the rooms 25, 50, and 75 places down the list from it. If 13 is chosen, for example, then the systematic random sample consists of the rooms numbered 13, 38, 63, and 88.
17. The last stage of the CPS uses a systematic sample. An example will illustrate the idea of a systematic sample. Suppose that we must choose 4 rooms out of the 100 rooms in a dormitory. Because , we can think of the list of 100 rooms as 4 lists of 25 rooms each. Choose 1 of the first 25 rooms at random, using Table 7.1 (page 298). The sample will contain this room and the rooms 25, 50, and 75 places down the list from it. If 13 is chosen, for example, then the systematic random sample consists of the rooms numbered 13, 38, 63, and 88.
- Use Table 7.1 (page 298) to choose a systematic random sample of 5 rooms from a list of 200. Enter the table at line 120.
- Your sample gives every room the same chance to be chosen. Explain why.
- Despite the answer in part (b), this sample is not an SRS. Explain why.
17.
(a) Because , we divide the list into 5 groups of 40. (By the way, if the list has 204 rooms, we divide it into 5 groups of 40 and a final group of 4. A sample contains a room from the final group only when the first room chosen is among the first 4 in the list.) Label the first 40 rooms 01 to 40. Line 120 chooses room 35. The sample consists of rooms 35, 75, 115, 155, and 195.
(b) Each of the first 40 rooms has chance 1 in 40 of being chosen. Each later room is chosen exactly when the corresponding room in the first 40 is chosen. Thus, every room has an equal chance: 1 in 40.
(c) The only possible samples consist of 5 rooms spaced 40 apart in the list. An SRS gives all samples of 5 rooms an equal chance to be chosen.
Question 7.48
![]() 18. An ethics institute selected a random sample of 100 U.S. high schools and then gave an in-class survey to all students in each selected school. Of the 29,760 students surveyed, 64% have cheated on a test and 30% have stolen from a store. This type of sample is known as a cluster sample. Why is this sample not an SRS from the population of all U.S. high school students?
18. An ethics institute selected a random sample of 100 U.S. high schools and then gave an in-class survey to all students in each selected school. Of the 29,760 students surveyed, 64% have cheated on a test and 30% have stolen from a store. This type of sample is known as a cluster sample. Why is this sample not an SRS from the population of all U.S. high school students?
7.4 Cautions About Sample Surveys
331
Question 7.49
![]() 19. An opinion poll calls 1334 randomly chosen residential telephone numbers, and then the interviewer asks to speak with an adult member of the household, inquiring, “How many movies have you watched in a movie theater in the past 12 months?”
19. An opinion poll calls 1334 randomly chosen residential telephone numbers, and then the interviewer asks to speak with an adult member of the household, inquiring, “How many movies have you watched in a movie theater in the past 12 months?”
- What population do you think the poll has in mind?
- In all, 931 people respond. What is the rate (percent) of nonresponse?
- Many responses to this question are likely to be inaccurate. Why?
19.
(a) All people aged 18 and over living in the United States.
(b) Of the 1334 called, 403 did not respond. The rate is , or about 30%
(c) It is hard to remember exactly how many movies you saw in the past 12 months.
Question 7.50
![]() 20. Randomized response: Suppose 30 students in a class participate in a survey in which they each flip a coin and do not reveal the result. If the result is tails, the student is supposed to give an honest answer to the question “Have you ever used a fake ID?” If the result is heads, the student is supposed to say “yes” to that question, regardless of what the true answer is. Suppose the results in the class are 18 “yes” answers and 12 “no” answers.
20. Randomized response: Suppose 30 students in a class participate in a survey in which they each flip a coin and do not reveal the result. If the result is tails, the student is supposed to give an honest answer to the question “Have you ever used a fake ID?” If the result is heads, the student is supposed to say “yes” to that question, regardless of what the true answer is. Suppose the results in the class are 18 “yes” answers and 12 “no” answers.
- If students follow the procedure correctly, is it true that all students who answered “no” have not used a fake ID?
- If students follow the procedure correctly, is it true that all students who have not used a fake ID answered “no”?
- On average, about half of the students who have not used a fake ID flipped tails, so what is your best estimate of the true number of students who have not used a fake ID?
- Based on the answer to part (c), what is your estimate of the true number and proportion of students who have used a fake ID?
- Do we have any way to know which of the 18 “yes” answers are truthful?
Question 7.51
![]() 21. Randomized response: Suppose 50 students in a college class participate in a survey in which they each flip a coin and do not reveal the result. If the result is tails, the student is supposed to give an honest answer to the question “Have you ever cheated on an exam in high school or in college?” If the result is heads, the student is supposed to say “yes” to that question, regardless of what the true answer is. Suppose the results in the class are 42 “yes” answers and 8 “no” answers.
21. Randomized response: Suppose 50 students in a college class participate in a survey in which they each flip a coin and do not reveal the result. If the result is tails, the student is supposed to give an honest answer to the question “Have you ever cheated on an exam in high school or in college?” If the result is heads, the student is supposed to say “yes” to that question, regardless of what the true answer is. Suppose the results in the class are 42 “yes” answers and 8 “no” answers.
- If students follow the procedure correctly, is it true that all students who answered “no” have not cheated on an exam either in high school or in college?
- If students follow the procedure correctly, is it true that all students who have not cheated on an exam either in high school or in college answered “no”?
- On average, about half of the students who have not cheated on an exam in high school or in college flipped tails, so what is your best estimate of the true number of students who have not cheated on an exam?
- Based on the answer to part (c), what is your estimate of the true number and proportion of students who have cheated on an exam either in high school or in college?
- Do we have any way to know which of the 42 “yes” answers are truthful?
21.
Sample response: (a) Yes. The only way a student can answer “no” is if the coin landed on tails, after which the student would have to answer the question honestly.
(b) Even though a student has not cheated, if the result of the coin flip is heads, then the student must answer “yes.” So the statement” It is true that all students who have not cheated on an exam in high school or in college answered ‘no’” would be a false statement.
(c) About 16 students have not cheated on an exam in high school or in college.
(d)
(e) No. There is no way of telling which of the “yes” answers are true.
Question 7.52
![]() 22. Comment on each of the following as a potential sample survey question. If the question is unclear, slanted, or too complicated, restate it using better words.
22. Comment on each of the following as a potential sample survey question. If the question is unclear, slanted, or too complicated, restate it using better words.
- Which of these best represents your opinion on gun control?
- The government should confiscate our guns.
- We have the right to keep and bear arms.
- In view of the escalating environmental degradation and predictions of serious resource depletion, would you favor economic incentives for recycling of resource-intensive consumer goods?
- More people have seen the movie Gone with the Wind than any other motion picture produced over the past century. Have you seen this movie?
Question 7.53
![]() 23. The wording of questions can strongly influence the results of a sample survey. You are writing an opinion poll question about a proposed amendment to the Constitution. You can ask if people are in favor of “changing the Constitution” or “adding to the Constitution” by approving the amendment. Which of these choices of wording will likely produce a much higher percentage in favor? Why do you think this is true?
23. The wording of questions can strongly influence the results of a sample survey. You are writing an opinion poll question about a proposed amendment to the Constitution. You can ask if people are in favor of “changing the Constitution” or “adding to the Constitution” by approving the amendment. Which of these choices of wording will likely produce a much higher percentage in favor? Why do you think this is true?
23.
Sample response: People are more reluctant to “change” the Constitution than to “add to” it. So the wording “adding to” will produce a higher percentage in favor.
7.5 Experiments
A-18
Question 7.54
![]() 24. As reported in College Teaching, in a 2006 article entitled “Humor in Pedagogy: How Ha-Ha Can Lead to Aha” (Vol. 54, Issue 1), R. L. Garner randomly assigned 117 undergraduates to “review lecture videos” on statistics research methods. The videos either did or did not have short bits of humor inserted. Students who viewed the humor-added version of the video gave significantly higher ratings in their opinion of the lesson, how well the lesson communicated information, and the quality of the instructor. Even more importantly, that same group of students also recalled and retained significantly more information on the topic.
24. As reported in College Teaching, in a 2006 article entitled “Humor in Pedagogy: How Ha-Ha Can Lead to Aha” (Vol. 54, Issue 1), R. L. Garner randomly assigned 117 undergraduates to “review lecture videos” on statistics research methods. The videos either did or did not have short bits of humor inserted. Students who viewed the humor-added version of the video gave significantly higher ratings in their opinion of the lesson, how well the lesson communicated information, and the quality of the instructor. Even more importantly, that same group of students also recalled and retained significantly more information on the topic.
332
- What is the explanatory variable?
- What is the response variable?
- Why is this an experiment?
- Why were students not initially told that the true purpose of the study was to assess the use of humor?
- Why do you think the study was done using a fixed- video format rather than through live teaching?
Question 7.55
![]() 25. In a study on the attitude of gratitude, 192 undergraduates were assigned randomly to one of three clusters and asked to keep a regular report on psychological and physical indicators. One cluster was given a prompt to list things in their lives they are grateful for, another cluster’s prompt was to list recent hassles, and the third cluster’s prompt was to simply list events that recently had an impact on them. The “gratitude group” generally reported higher well-being. [R. A. Emmons and M. E. McCullough, Counting blessings versus burdens, Journal of Personality and Social Psychology 84(2) (2003):377–389.]
25. In a study on the attitude of gratitude, 192 undergraduates were assigned randomly to one of three clusters and asked to keep a regular report on psychological and physical indicators. One cluster was given a prompt to list things in their lives they are grateful for, another cluster’s prompt was to list recent hassles, and the third cluster’s prompt was to simply list events that recently had an impact on them. The “gratitude group” generally reported higher well-being. [R. A. Emmons and M. E. McCullough, Counting blessings versus burdens, Journal of Personality and Social Psychology 84(2) (2003):377–389.]
- What is the explanatory variable?
- What is the response variable?
- Why is this an experiment?
- Does this experiment address whether it is more reasonable to say that well-being causes gratitude or that gratitude causes well-being?
25.
(a) Journal response type is the explanatory variable.
(b) Personal well-being is the response variable.
(c) We have three groups, where each was given a random assignment.
(d) Gratitude causes well-being.
Question 7.56
26. Will owning a video-game system hurt the academic development of young boys? You are interested in tracking time spent playing video games, time spent in academic activities, teacher-reported learning problems, and reading and writing scores four months later. Outline the design of an experiment to study the effect of video-game ownership.
Question 7.57
27. We want to investigate the following question: Will classroom programs explaining the health advantages of drinking water rather than sugary sodas reduce obesity among children aged 7 to 11 years? Because children are already grouped in school classrooms, we must randomize classes rather than individual children. An experiment assigned 15 classes to receive the program and another 14 to form a control group. After 12 months, obesity had increased in the control group and remained steady in the treatment group. Outline the design of the experiment, label the available classes, and use Table 7.1 (page 298), beginning at line 103, to carry out the random assignment.
27.
The design resembles Figure 7.3 (page 307).
Be sure to show randomization, two groups and their treatments, and the response variable (change in obesity).
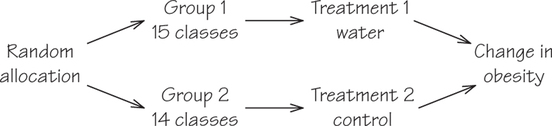
If we label the 29 classes 01 to 29 and choose 15 for the treatment group, this group contains classes 17, 09, 22, 13, 07, 02, 27, 01, 18, 25, 29, 19, 14, 15, and 8. We used lines 103 to 106 of Table 7.1 (page 298), skipping any duplicate pairs of digits. In order, these classes are 1, 2, 7, 8, 9, 13, 14, 15, 17, 18, 19, 22, 25, 27, and 29. The remaining 14 classes make up the control group.
Question 7.58
![]() 28. A college allows students to choose either classroom or self-paced instruction in a basic mathematics course. The college wants to compare the effectiveness of self-paced and regular instruction. Someone proposes giving the same final exam to all students in both versions of the course and comparing the average score of those who took the self-paced option with the average score of students in regular sections.
28. A college allows students to choose either classroom or self-paced instruction in a basic mathematics course. The college wants to compare the effectiveness of self-paced and regular instruction. Someone proposes giving the same final exam to all students in both versions of the course and comparing the average score of those who took the self-paced option with the average score of students in regular sections.
- Explain why confounding makes the results of that study worthless.
- Given 30 students who are willing to use either regular or self-paced instruction, outline an experimental design to compare the two methods of instruction. Then use Table 7.1 (page 298), starting at line 108, to carry out the randomization.
Question 7.59
![]() 29. Two second-grade teachers, Miss Earls (who is an experienced teacher) and Mrs. Gifford (who is in her second year of teaching), were really excited about a new curriculum that utilized animations to teach science. They decided to use their classrooms for an experiment. Since Miss Earls had access to computers in her class, she used the animation lessons. Mrs. Gifford covered similar material with her students using handouts followed by discussions. After students had completed the materials, they were given a test designed by Miss Earls. There were 21 students in Miss Earls’s class and 29 students in Mrs. Gifford’s class. Miss Earls’s class scored, on average, 12 points higher on the test.
29. Two second-grade teachers, Miss Earls (who is an experienced teacher) and Mrs. Gifford (who is in her second year of teaching), were really excited about a new curriculum that utilized animations to teach science. They decided to use their classrooms for an experiment. Since Miss Earls had access to computers in her class, she used the animation lessons. Mrs. Gifford covered similar material with her students using handouts followed by discussions. After students had completed the materials, they were given a test designed by Miss Earls. There were 21 students in Miss Earls’s class and 29 students in Mrs. Gifford’s class. Miss Earls’s class scored, on average, 12 points higher on the test.
- Explain why confounding makes the results of these teachers’ study worthless. What are some of the confounding variables?
- Given that the principal would allow the 50 students in the two classes to be reassigned to these two teachers for this experiment and would allow the teachers to switch rooms, outline an experimental design to compare the two methods of science instruction. Use either Table 7.1 or technology to carry out the randomization.
29.
(a) Sample response: The type of instruction that each teacher would use was determined not by chance, but rather by the fact that only one of the teachers had computers in her classroom. Furthermore, this was the classroom of the more experienced teacher. Confounding variables are teacher experience, class size, classroom setup (computers versus no computers), and the fact that only one of the teachers drafted the test (which could be biased toward the animated science lessons).
(b) The design resembles Figure 7.3.
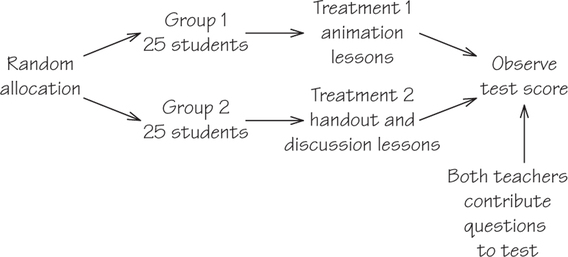
To choose the students, each is given a label, 1–50. Using either Excel and Rand() or the TI-84 calculator and randIntNoRep, a random sample of size 25 is chosen. Here is one possible sample with labels written in order from smallest to largest: 1, 3, 6, 9, 11, 12, 13, 14, 16, 17, 18, 19, 24, 30, 32, 33, 34, 35, 36, 38, 40, 41, 42, 43, 48.
333
Question 7.60
30. Track down a print or online copy of the Bible. Chapter 1 of the book of Daniel (especially verses 12 through 16) appears to include the first clinical trial in recorded history. Outline the design of the experiment. Is this an example of an uncontrolled experiment, a comparative experiment, or a randomized comparative experiment? Explain.
Question 7.61
31. Will people spend less on healthcare if their health insurance requires them to pay some part of the cost themselves? An experiment on this issue asked if the percentage of medical costs that is paid by health insurance has an effect either on the amount of medical care that people use or on their health. The treatments were four insurance plans, each of which paid all medical costs above a ceiling. Below the ceiling, the plans paid 100%, 75%, 50%, or 0% of costs incurred. Outline the design of a randomized comparative experiment suitable for this study.
31.
This is a randomized comparative experiment with four branches, similar to Figure 7.3 but with four groups. The “flowchart” outline must show random assignment of subjects to groups, the four treatments, and the response variable (healthcare spending).
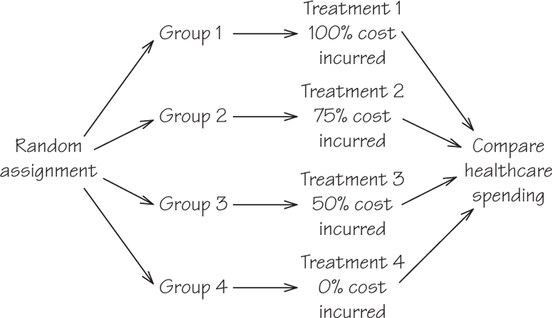
We can’t show the group sizes because we don’t know how many people or households are available to participate.
Question 7.62
32. The research question for an undergraduate research project was whether hearing-impaired customers were treated differently by store clerks than non-hearing-impaired customers. There were 20 customers, 10 of whom were hearing impaired. The customers were sent in pairs into stores. The hearing- impaired pairs used sign language to communicate with each other and the non-hearing-impaired pairs entered stores speaking English to each other. The subjects consisted of 77 salesclerks in 27 stores (from 175 stores) in a large shopping mall. The response variable was the time that elapsed from when the pair entered the store and made eye contact with the salesclerk until the clerk approached and offered assistance. Describe how you would design the rest of the experiment.
Question 7.63
33. Stores advertise price reductions to attract customers. What type of price cut is most attractive? Market researchers prepared ads for athletic shoes announcing different levels of discounts (20%, 40%, or 60%). The student subjects who read the ads were also given “inside information” about the fraction of shoes on sale (50% or 100%). Each subject then rated the attractiveness of the sale on a scale of 1 to 7.
- Each treatment in this experiment is a combination of values of two explanatory variables: discount level and fraction on sale. List all the treatments.
- Outline a randomized comparative experiment using 60 student subjects. Use Table 7.1 (page 298) at line 123 to choose the subjects for the first treatment.
33.
(a) There are six treatments, each combination of a level of discount and fraction on sale. In table form, the treatments are as follows:
| Discount Level | |||
| 20% | 40% | 60% | |
| 50% on sale | 1 | 2 | 3 |
| 100% on sale | 4 | 5 | 6 |
The six treatments are as follows (enumerated for ease of reading):
Treatment 1: 20% off shoes; 50% of shoes on sale
Treatment 2: 40% off shoes; 50% of shoes on sale
Treatment 3: 60% off shoes; 50% of shoes on sale
Treatment 4: 20% off shoes; 100% of shoes on sale
Treatment 5: 40% off shoes; 100% of shoes on sale
Treatment 6: 60% off shoes; 100% of shoes on sale
(b) The outline randomly assigns 10 students to each of the 6 treatment groups, then compares the attractiveness ratings. It resembles Figure 7.3, but with 6 branches.
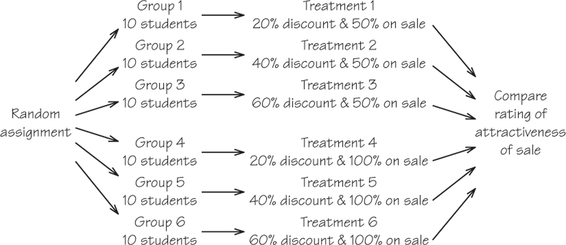
Label the subjects 01 to 60 and read line 123 of Table 7.1 (page 298). The first group contains subjects labeled 54, 58, 08, 15, 07, 27, 10, 25, 60, and 55. In order, these are 7, 8, 10, 15, 25, 27, 54, 55, 58, and 60.
Question 7.64
34. You wish to learn if students in an English course write better essays when they are required to use computer word-processing than when they write and revise their essays by hand. There are 120 students in an English course available as subjects.
- Outline the design of an experiment to determine whether word-processing results in better essays.
- What precautions would you take in completing this experiment that do not appear in your outline of the design?
Question 7.65
35. Eye cataracts are responsible for over 40% of blindness around the world. Can drinking tea regularly slow the growth of cataracts? We can’t experiment on people, so we use rats as subjects. Researchers injected 14 young rats with a substance that causes cataracts. Half the rats also received tea extract; the other half got a placebo. The response variable was the growth of cataracts over the next six weeks. The researchers found that the tea extract did slow cataract growth in the rats.
- Outline the design of this experiment.
- Use Table 7.1 (page 298), starting at line 108, to assign rats to treatments.
35.
(a) The design resembles Figure 7.3.
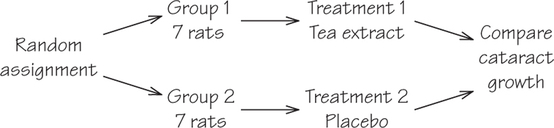
(b) Label the rats 01 to 14. The tea group contains 07, 09, 06, 08, 12, 04, and 11. In order, these are 4, 6, 7, 8, 9, 11, and 12.
A-19
Question 7.66
![]() 36. The rats in the previous exercise were labeled 01 to 14. Unknown to the researchers, the 5 rats labeled 01 to 05 have a genetic defect that favors cataracts. If we simply put rats 01 to 07 in the tea group, the experiment would be biased against tea. We can observe how random selection works to reduce bias by keeping track of how many of these 5 rats are assigned to the tea group. Use one of the technology procedures in Spotlight 7.1 (page 300) to carry out the random assignment of 7 rats to the tea group 25 times, keeping track of how many of rats 01 to 05 are in the tea group each time. Make a histogram of the count of rats 01 to 05 assigned to tea. What is the average number in your 25 tries? Based on your results, describe how random selection works to reduce bias.
36. The rats in the previous exercise were labeled 01 to 14. Unknown to the researchers, the 5 rats labeled 01 to 05 have a genetic defect that favors cataracts. If we simply put rats 01 to 07 in the tea group, the experiment would be biased against tea. We can observe how random selection works to reduce bias by keeping track of how many of these 5 rats are assigned to the tea group. Use one of the technology procedures in Spotlight 7.1 (page 300) to carry out the random assignment of 7 rats to the tea group 25 times, keeping track of how many of rats 01 to 05 are in the tea group each time. Make a histogram of the count of rats 01 to 05 assigned to tea. What is the average number in your 25 tries? Based on your results, describe how random selection works to reduce bias.
7.6 Experiments Versus Observational Studies
Question 7.67
37. The article “Smoking, Smoking Cessation, and Risk for Type 2 Diabetes Mellitus” published in the Annals of Internal Medicine (January 2010) reported on a study that followed 10,892 middle-aged adults over a nine-year period. At the start of the study, none of the subjects had diabetes. Roughly 45% of the subjects were smokers. The study found that compared to those who never smoked, subjects who quit smoking had an increased risk of diabetes.
- Is the study described above an observational study or an experiment? Explain.
- Based on this study, should you conclude that quitting smoking causes diabetes? Justify your answer.
37.
(a) This is an observational study—a prospective study. It takes a group of people, both smokers and nonsmokers, and observes them over a nine-year period. The response variable is whether or not the subject develops diabetes. The purpose of the study is to describe the response variable (diabetic/not diabetic) for those who were smokers versus nonsmokers at the start of the study, as well as those who were smokers and later quit smoking.
(b) You cannot conclude that quitting smoking causes diabetes. Most people who quit smoking also gain weight. Weight gain is also associated with diabetes. So, it would be impossible to tell whether the diabetes was caused by the cessation of smoking or the gain in weight.
334
Question 7.68
38. Healthcare providers are giving more attention to relieving the pain of cancer patients. An article in the journal Cancer surveyed a number of studies and concluded that controlled-release (CR) morphine tablets, which release the painkiller gradually over time, are more effective than giving standard morphine when the patient needs it. The “methods” section of the article begins: “Only those published studies that were controlled (i.e., randomized, double-blind, and comparative), repeated- dose studies with CR morphine tablets in cancer pain patients were considered for this review” [C. A. Warfield, Controlled-release morphine tablets in patients with chronic cancer pain, Cancer, 82(12) (1998): 2299–2306]. Explain the terms in parentheses to someone who knows nothing about medical trials.
Question 7.69
![]() 39. Could the magnetic fields from power lines cause leukemia in children? Investigators who wanted to explore this question spent five years and $5 million comparing 638 children who had leukemia and 620 who did not. They went into the homes and actually measured the magnetic fields in the children’s bedrooms, in other rooms, and at the front door. They recorded facts about nearby power lines for the family home, as well as for the mother’s residence when she was pregnant. Result: They found no evidence of more than a chance connection between magnetic fields and childhood leukemia. Explain carefully why this study is not an experiment, and state what kind of study it is.
39. Could the magnetic fields from power lines cause leukemia in children? Investigators who wanted to explore this question spent five years and $5 million comparing 638 children who had leukemia and 620 who did not. They went into the homes and actually measured the magnetic fields in the children’s bedrooms, in other rooms, and at the front door. They recorded facts about nearby power lines for the family home, as well as for the mother’s residence when she was pregnant. Result: They found no evidence of more than a chance connection between magnetic fields and childhood leukemia. Explain carefully why this study is not an experiment, and state what kind of study it is.
39.
No treatment was imposed on the subjects. This observational study collected detailed information about the subjects but made no attempt to influence them. This is a retrospective study since the children were broken into two groups at the start of the study, those with leukemia and those who did not have leukemia, and then it looked for possible links between magnetic fields in the children’s environment and the illness.
Question 7.70
![]() 40. A typical hour of prime-time television shows three to five violent acts. Linking family interviews and police records shows a clear association between time spent watching TV as a child and later aggressive behavior.
40. A typical hour of prime-time television shows three to five violent acts. Linking family interviews and police records shows a clear association between time spent watching TV as a child and later aggressive behavior.
- Explain why this is an observational study rather than an experiment.
- Suggest several variables describing a child’s home life that may be confounded with how much TV he or she watches.
- Explain why confounding makes it difficult to conclude that more TV causes more aggressive behavior.
Question 7.71
![]() 41. The Nurses’ Health Study has interviewed a sample of more than 100,000 female registered nurses every two years since 1976. Beginning in 1980, the study asked questions about diet, including alcohol consumption. The researchers concluded that “light-to- moderate drinkers had a significantly lower risk of death” than either nondrinkers or heavy drinkers.
41. The Nurses’ Health Study has interviewed a sample of more than 100,000 female registered nurses every two years since 1976. Beginning in 1980, the study asked questions about diet, including alcohol consumption. The researchers concluded that “light-to- moderate drinkers had a significantly lower risk of death” than either nondrinkers or heavy drinkers.
- Is the Nurses’ Health Study an observational study or an experiment? Why?
- What does significant mean in a statistical report?
- Suggest some confounding variables that might explain why moderate drinkers have lower death rates than nondrinkers. (The study adjusted for these variables.)
41.
Sample response: (a) It is an observational study that gathers information (e.g., through interviews) without imposing any treatment.
(b) Significant means “unlikely to be due simply to chance.”
(c) Nondrinkers might be more elderly or in poorer health than moderate drinkers.
Question 7.72
![]() 42. The financial aid office of a university asks a sample of students about their employment and earnings. The report says that “for academic year earnings, a statistically significant difference was found between the sexes, with men earning more on the average. No significant difference was found between the earnings of black and white students.” Explain both of these conclusions, for the effects of sex and of race on average earnings, in language understandable to someone who knows nothing about statistics. Do not use the words significant or significance in your answer.
42. The financial aid office of a university asks a sample of students about their employment and earnings. The report says that “for academic year earnings, a statistically significant difference was found between the sexes, with men earning more on the average. No significant difference was found between the earnings of black and white students.” Explain both of these conclusions, for the effects of sex and of race on average earnings, in language understandable to someone who knows nothing about statistics. Do not use the words significant or significance in your answer.
Question 7.73
![]() 43. People who eat lots of fruits and vegetables have lower rates of colon cancer than those who eat little of these foods. Fruits and vegetables are rich in antioxidants such as vitamins A, C, and E. Will taking antioxidant pills help prevent colon cancer? A clinical trial studied this question with 864 people who were at risk for colon cancer. The subjects were divided into four groups: those who took daily beta carotene (related to vitamin A), those who took daily vitamins C and E, those who took all three vitamins every day, and those who took a daily placebo. After four years, the researchers were surprised to find no significant difference in colon cancer among the groups.
43. People who eat lots of fruits and vegetables have lower rates of colon cancer than those who eat little of these foods. Fruits and vegetables are rich in antioxidants such as vitamins A, C, and E. Will taking antioxidant pills help prevent colon cancer? A clinical trial studied this question with 864 people who were at risk for colon cancer. The subjects were divided into four groups: those who took daily beta carotene (related to vitamin A), those who took daily vitamins C and E, those who took all three vitamins every day, and those who took a daily placebo. After four years, the researchers were surprised to find no significant difference in colon cancer among the groups.
- Outline the design of the experiment. Use your judgment in choosing the group sizes.
- Assign labels to the 864 subjects and use Table 7.1 (page 298), starting at line 118, to choose the first five subjects for the “beta carotene” group.
- The study was double-blind. What does this mean?
- What does “no significant difference” mean in describing the outcome of the study?
- Suggest some characteristics of the kind of people who eat lots of fruits and vegetables that might explain lower rates of colon cancer. The experiment suggests that these variables, rather than the antioxidants, may be responsible for the observed benefits of fruits and vegetables.
43.
(a) This is a randomized comparative experiment with four branches. The “flowchart” outline must show random assignment of subjects to groups, the group sizes and treatments, and the response variable (colon cancer). It is best to use groups of equal size, 216 people in each group.
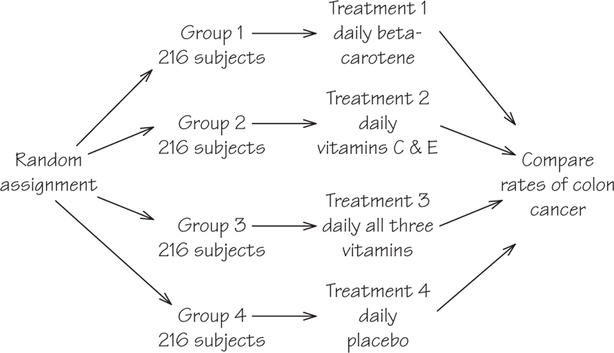
(b) With labels 001 to 864, the first five chosen are 731, 253, 304, 470, and 296. In order, these are 253, 296, 304, 470, and 731.
(c) Neither those working with the subjects nor the subjects know the contents of the pill each subject took daily.
(d) The differences in colon cancer cases in the four groups were so small that they could easily be due to the chance assignment of subjects to groups.
(e) People who eat lots of fruits and vegetables may eat less meat or more cereals than
other people. They may drink less alcohol or exercise more.
Question 7.74
![]() 44. Dr. Megan Moreno sent a cautionary message to a randomly selected half of a sample of MySpace users (ages 18–20) whose public profiles included references to sex and substance abuse. A review of all profiles from the original sample three months later showed that those who had received the email were more likely to have removed the references from their online profiles or to have changed their profile setting to “private.” Is this an experiment or observational study, and how do you know?
44. Dr. Megan Moreno sent a cautionary message to a randomly selected half of a sample of MySpace users (ages 18–20) whose public profiles included references to sex and substance abuse. A review of all profiles from the original sample three months later showed that those who had received the email were more likely to have removed the references from their online profiles or to have changed their profile setting to “private.” Is this an experiment or observational study, and how do you know?
335
Question 7.75
![]() 45. A study reported on 533,715 women at least 40 years old who were diagnosed with invasive breast cancer and reported to the National Cancer Data Base (NCDB). The study found strong evidence that patients without health insurance were more likely to have a more advanced stage of cancer (i.e., stage III or IV). Is this an experiment or observational study, and how do you know? [M. T. Halpern et al., Insurance status and stage of cancer at diagnosis among women with breast cancer, Cancer, 110(2) (2007): 403–411.]
45. A study reported on 533,715 women at least 40 years old who were diagnosed with invasive breast cancer and reported to the National Cancer Data Base (NCDB). The study found strong evidence that patients without health insurance were more likely to have a more advanced stage of cancer (i.e., stage III or IV). Is this an experiment or observational study, and how do you know? [M. T. Halpern et al., Insurance status and stage of cancer at diagnosis among women with breast cancer, Cancer, 110(2) (2007): 403–411.]
45.
This is an observational study. There was a measurement of information, but no attempt was made to influence the response.
7.7 Inference: From Sample to Population
Question 7.76
46. An opinion poll uses random digit dialing equipment to select 2000 residential telephone numbers. Of these, 631 are unlisted numbers. This isn’t surprising, because 35% of all residential numbers are unlisted. For each underlined number, state whether it is a parameter or a statistic.
Question 7.77
47. In the 1980s, the Tennessee Student Teacher Achievement Ratio experiment randomly assigned more than 7000 children to regular or small classes during their first four years of school. Even though the treatment lasted only from kindergarten to third grade, there were differences (in favor of the students in the smaller classes) that were noticeable even many years later. For example, when these same children reached high school, 40.2% of Black students from the small classes took the ACT or SAT college entrance exam. Only 31.7% of Black students from the regular classes took one of these exams. For each underlined number, state whether it is a parameter or a statistic.
47.
Both are statistics because both describe the sample (the subjects who took part in the study).
Question 7.78
48. At a college in Singapore, students were randomly selected and asked to complete a Web-based survey about sexual behavior. Of those selected, 534 students completed the survey. Suppose that the population proportion of those having had sexual intercourse in the past six months was .
- What are the mean and standard deviation of the proportion of the sample who have had sexual intercourse over the past six months?
- In what interval of values do the proportions from 95% of all samples fall?
- In what interval of values do the proportions from 99.7% of all samples fall?
Question 7.79
49. Harley-Davidson motorcycles make up 14% of all the motorcycles registered in the United States. You plan to interview an SRS of 500 motorcycle owners.
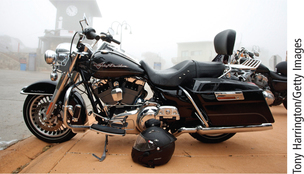
- What is the approximate distribution of the proportion of your sample who own Harleys?
- In 95% of all samples like this one, the proportion of the sample who own Harleys will fall between __________ and _________. What are the missing numbers?
49.
(a) The distribution is approximately normal with mean of and a standard deviation as follows:
(b)
Question 7.80
![]() 50. Exercise 48 asks what values the sample proportion is likely to take when the population proportion is and the sample size is . What interval covers the middle 95% of values of when and ? When ? When ? What general fact about the behavior of do your results illustrate?
50. Exercise 48 asks what values the sample proportion is likely to take when the population proportion is and the sample size is . What interval covers the middle 95% of values of when and ? When ? When ? What general fact about the behavior of do your results illustrate?
Question 7.81
![]() 51. You can use a table of random digits to simulate sampling from a population. Suppose that 60% of the population bought a lottery ticket in the last 12 months. We will simulate the behavior of random samples of size 40 from this population.
51. You can use a table of random digits to simulate sampling from a population. Suppose that 60% of the population bought a lottery ticket in the last 12 months. We will simulate the behavior of random samples of size 40 from this population.
- Let each digit in the table stand for one person in this population. Digits 0 to 5 stand for people who bought a lottery ticket, and 6 to 9 stand for people who did not. Why does looking at one digit from Table 7.1 (page 298) simulate drawing one person at random from a population with 60% “yes”?
- Each row in Table 7.1 contains 40 digits. So the first 10 rows represent the results of 10 samples. How many digits between 0 and 5 does the top row contain? What is the percentage of “yes” responses in this sample? How many of your 10 samples overestimated the population proportion of 60%? How many underestimated it? (You could program a computer to continue this process, say, 1000 times, to produce a pattern like that in Figure 7.6 on page 316.)
51.
(a) Each digit in the table has 1 chance in 10 to be any of the 10 possible digits 0, 1, 2, 3, 4, 5, 6, 7, 8, 9. So in the long run, 60% of the digits we encounter will be 0, 1, 2, 3, 4, or 5, and 40% will be 6, 7, 8, or 9.
(b) Line 101 contains 29 digits 0 to 5. This stands for a sample with “yes” responses. If we use lines 101 to 110 to simulate 10 samples, the counts of “yes” responses are 29, 24, 23, 23, 20, 24, 23, 19, 24, and 18. Thus, three samples are exactly correct ( ), one overestimates, and six underestimate.
336
Question 7.82
52. In a random sample of students who took the SAT Reasoning college entrance exam twice, it was found that 427 of the respondents had paid for coaching courses and that the remaining 2733 had not.
- What is the sample proportion of coaching among students who retake the SAT?
- Give a 95% confidence interval for the proportion of coaching among students who retake the SAT.
Question 7.83
53. A Gallup poll asked each of 1785 randomly selected adults whether he or she happened to attend a house of worship in the previous seven days. Of the respondents, 750 said “yes.”
- Determine the sample proportion of those who answered “yes.”
- Give a 95% confidence interval for the proportion of all adults who claim that they attended a house of worship during the week preceding the poll.
(The proportion who actually attended may be lower; some people might say “yes” if they often attend, even if they didn’t attend that particular week.)
53.
(a) The sample proportion who claim to have attended is .
(b) The approximate 95% confidence interval is calculated as follows:
The interval would be (0.397, 0.443).
Question 7.84
54. A CBS News poll conducted July 29–August 4, 2014, surveyed 1344 randomly selected American adults. Of those surveyed, 726 say that their sympathies in the Middle East situation lie more with the Israelis than with the Palestinians.
- Give a 95% confidence interval for the proportion of all American adults whose sympathies in the Middle East situation lie more with the Israelis than with the Palestinians.
- The poll reported a margin of error of ±3%. Explain how your results agree with this statement.
Question 7.85
![]() 55.
55.
 A telephone survey of 880 randomly selected drivers asked, “Recalling the last 10 traffic lights you drove through, how many of them were red when you entered the intersections?” Of the 880 respondents, 171 admitted that at least one light had been red.
- Give a 95% confidence interval for the proportion of all drivers who ran one or more of the last 10 red lights they came across.
- A practical problem with this survey is that people may not give truthful answers. What is the likely direction of the bias: Do you think more or fewer than 171 of the 880 respondents really ran a red light? Why?
55.
(a) The sample proportion who admit running a red light is . The approximate 95% confidence interval is calculated as follows:
The interval would be (0.167, 0.221).
(b) It is likely that more than 171 ran a red light, because some people are reluctant to admit illegal or antisocial acts.
A-20
Question 7.86
![]() 56. A Gallup poll conducted May 2–7, 2013, by telephone interviews (both landlines and cellular phones) of 1535 American adults found that 59% of Americans regarded gay and lesbian relations as morally acceptable.
56. A Gallup poll conducted May 2–7, 2013, by telephone interviews (both landlines and cellular phones) of 1535 American adults found that 59% of Americans regarded gay and lesbian relations as morally acceptable.
- How many of the 1535 people interviewed said gay and lesbian relations were morally acceptable?
- Gallup indicates that the margin of error for this poll is ±3 percentage points. Explain to someone who knows nothing about statistics what “margin of error ±3 percentage points” means.
- Give a 95% confidence interval for this survey. Does your margin of error agree with the 3 percentage points announced by Gallup?
Question 7.87
![]() 57. Consider the margin of error formula .
57. Consider the margin of error formula .
- For a fixed value of , what value of between 0 and 1 causes this formula to attain its largest possible value?
- Using the answer to part (a), what would be a simplified (and slightly more conservative) formula for calculating the margin of error?
57.
(a)
(b)
Question 7.88
![]() 58. A news article reports that in a recent Gallup poll, 78% of the sample of 1108 adults said they believe heaven exists. Only 60% said they believe there is a hell. The news article ends, “The poll’s margin of sampling error was plus or minus 4 percentage points.” Can we be certain that between 56% and 64% of all adults believe hell exists? Explain your answer.
58. A news article reports that in a recent Gallup poll, 78% of the sample of 1108 adults said they believe heaven exists. Only 60% said they believe there is a hell. The news article ends, “The poll’s margin of sampling error was plus or minus 4 percentage points.” Can we be certain that between 56% and 64% of all adults believe hell exists? Explain your answer.
Question 7.89
![]() 59. A survey of Internet users found that males outnumbered females by nearly 2 to 1. This was a surprise because earlier surveys had put the ratio of men to women closer to 9 to 1. Later, the article about the research states that surveys were sent to 13,000 organizations and that 1468 of these responded. The survey report claims that “the margin of error is 2.8 percent, with 95% confidence.”
59. A survey of Internet users found that males outnumbered females by nearly 2 to 1. This was a surprise because earlier surveys had put the ratio of men to women closer to 9 to 1. Later, the article about the research states that surveys were sent to 13,000 organizations and that 1468 of these responded. The survey report claims that “the margin of error is 2.8 percent, with 95% confidence.”
- What was this survey’s response rate? (The response rate is the percentage of the planned sample that responded.)
- Do you think that the small margin of error is a good measure of the accuracy of the survey’s results? Explain your answer.
59.
(a)
(b) No. The response rate is so low that it is likely that those who responded differ from the population as a whole. That is, there is a bias that the margin of error does not include.
Question 7.90
60. A recent Gallup telephone poll found that 68% of adult Americans favor teaching creationism along with evolution in public schools. The Gallup press release states:
For results based on samples of this size, one can say with 95% confidence that the maximum error attributable to sampling and other random effects is plus or minus 3 percentage points.
Give one example of a source of error in the poll result that is not included in this margin of error.
337
Question 7.91
![]() 61. The Internal Revenue Service (IRS) plans to examine an SRS of individual income tax returns from each state that were filed electronically. One variable of interest is the proportion of returns that were filed by a tax practitioner rather than by an individual taxpayer. The total number of e-filed tax returns in a state varies from 4.9 million in California to 97,000 in Vermont.
61. The Internal Revenue Service (IRS) plans to examine an SRS of individual income tax returns from each state that were filed electronically. One variable of interest is the proportion of returns that were filed by a tax practitioner rather than by an individual taxpayer. The total number of e-filed tax returns in a state varies from 4.9 million in California to 97,000 in Vermont.
- Will the margin of error for estimating the proportion change from state to state if an SRS of 1000 e-filed returns is selected in each state? Explain your answer.
- Will the margin of error change from state to state if an SRS of 1% of all e-filed returns is selected in each state? Explain your answer.
61.
(a) No. The number of e-filed returns in all states is much larger than the sample size. When this is true, the margin of error depends only on the size of the sample, not on the size of the population.
(b) Yes. The sample sizes vary from 970 to 49,000, so the margins of error will also vary.
Question 7.92
![]() 62. Exercise 56 describes a Gallup poll that interviewed 1535 people. Suppose that you want a margin of error half as large as the one you found in that exercise. How many people must you plan to interview?
62. Exercise 56 describes a Gallup poll that interviewed 1535 people. Suppose that you want a margin of error half as large as the one you found in that exercise. How many people must you plan to interview?
Question 7.93
![]() 63. Though opinion polls usually make 95% confidence statements, some sample surveys use other confidence levels. The monthly unemployment rate, for example, is based on the CPS of about 50,000 households. The margin of error in the unemployment rate is announced as about ±0.15% with 90% confidence. Is the margin of error for 90% confidence larger or smaller than the margin of error for 95% confidence? Why? (Hint: Look again at Figure 7.12, on page 323.)
63. Though opinion polls usually make 95% confidence statements, some sample surveys use other confidence levels. The monthly unemployment rate, for example, is based on the CPS of about 50,000 households. The margin of error in the unemployment rate is announced as about ±0.15% with 90% confidence. Is the margin of error for 90% confidence larger or smaller than the margin of error for 95% confidence? Why? (Hint: Look again at Figure 7.12, on page 323.)
63.
The margin of error for 90% confidence comes from the central 90% of a normal sampling distribution. We need not go as far out to cover 90% of the distribution as to cover 95%. So the margin of error for 90% confidence is smaller than for 95% confidence.
Chapter Review
Question 7.94
64. The proportion of one’s body that is fat is a key indicator of fitness. The many ways to estimate this have different margins of error (given in percentage points):
| Method | Calipers pinch |
Bioelectrical impedance |
Body mass index calculator |
Hydrostatic weighing (dunk test) |
|---|---|---|---|---|
| Margin of error | ±3 | ±4 | ±10 | ±1 |
- Which of these tests is the least accurate?
- If the pinch test says that you have 21% body fat, what is the 95% confidence interval for this estimate?
Question 7.95
65. Many medical trials randomly assign patients to either an active treatment or a placebo. These trials are always double-blind. Sometimes the patients can tell whether they are getting the active treatment. This defeats the purpose of blinding. Reports of medical research usually ignore this problem. Investigators looked at a random sample of 97 articles reporting on placebo-controlled randomized trials in the top five general medical journals. Only 7 of the 97 discussed the success of blinding. Give a 95% confidence interval for the proportion of all such articles that discuss the success of blinding. [Dean Fergusson et al., Turning a blind eye: The success of blinding reported in a random sample of randomised, placebo-controlled trials, British Medical Journal, 328 (2004): 432–436.]
65.
The sample proportion of successes is . That is, there were 7.2% successes in the sample. The approximate 95% confidence interval is calculated as follows:
We are 95% confident that the true proportion of articles that discuss the success of blinding is between 0.020 and 0.124 (that is, 2.0% to 12.4%).
The distribution of the sample proportion is approximately normal with mean (i.e., 10%) and standard deviation
or 3%. Notice that 7% is 1 standard deviation below the mean. By the 68 part of the 68-95-99.7 rule, 68% of all samples will have between 7% and 13% that discuss blinding. Half of the remaining 32% of all samples lie on either side. So 16% of samples will have fewer than 7% articles that discuss blinding. That is, the probability is about 0.16.
Question 7.96
66. Tomeka wants to ask a sample of students at her college, “Do you think that Social Security will still be paying benefits when you retire?” She obtains the college email addresses of all 2654 students attending the college.
- How would you label the addresses to choose a simple random sample of 100 students?
- Use Table 7.1 (page 298), starting at line 103, to choose the first three labels in the sample.
- Tomeka emails her question to the 100 addresses in her sample. Although she has chosen an SRS, a serious practical difficulty may make it hard to draw clear conclusions from her sample. What practical difficulty do you expect Tomeka to encounter?
Question 7.97
![]() 67. Suppose that exactly 10% of all articles in major medical journals that describe placebo-controlled randomized trials discuss the success of blinding. That is, the proportion of “successes” in the population is . What is the approximate probability that fewer than 7% of an SRS of 97 articles from this population discuss the success of blinding?
67. Suppose that exactly 10% of all articles in major medical journals that describe placebo-controlled randomized trials discuss the success of blinding. That is, the proportion of “successes” in the population is . What is the approximate probability that fewer than 7% of an SRS of 97 articles from this population discuss the success of blinding?
67.
The distribution of the sample proportion pˆ is approximately normal with mean p = 0.1 (i.e., 10%) and standard deviation
or 3%. Notice that 7% is 1 standard deviation below the mean. By the 68 part of the 68–95–99.7 rule, 68% of all samples will have between 7% and 13% that discuss blinding. Half of the remaining 32% of all samples lie on either side. So 16% of samples will have fewer than 7% articles that discuss blinding. That is, the probability is about 0.16.
Question 7.98
68. The ability to grow in shade may help pines found in the dry forests of Arizona resist drought. How well do these pines grow in shade? Investigators planted pine seedlings in a greenhouse in either full light or light reduced to 5% of normal by shade cloth. At the end of the study, they dried the young trees and weighed them.
- Explain why this study is an experiment.
- What are the individuals, the treatments, and the response variable in this experiment?
- You have 200 pine seedlings available. Outline the design that you would use for this experiment.
338
Question 7.99
69. The National Children’s Study (NCS), the largest and most detailed study ever on children’s health in the United States, is examining environmental effects on a large sample of children (from roughly 100,000 families) from before birth to age 21 years. Learn more at www.nationalchildrensstudy.gov.
- Explain why this is an observational study.
- Is this observational study prospective or retrospective?
- Why couldn’t this study be done as an experiment?
69.
(a) This is an observational study because there was no manipulation of environment or assignment of treatment.
(b) This is a prospective study.
(c) This study could not have been done as an experiment because one cannot manipulate or control the environment throughout the 21+ years.
Question 7.100
70. A random sample of 2454 twelfth-grade American students responded to the following question: “Taking all things together, how would you say things are these days—would you say you’re happy or not too happy?” Of the responses, 2098 students selected “happy.”
- Calculate a 95% confidence interval for the population proportion of twelfth-grade American students who are happy.
- Would a 97% confidence interval for the proportion of happy students be wider or narrower than the one you calculated for part (a)? Justify your answer.
Question 7.101
![]() 71. Rasmussen Report conducted a national telephone survey of a random sample of 1000 U.S. adults from June 19 to 20, 2013. Results indicated that 63% of adults nationwide would agree with the statement “Most Americans want the government to have less power and money.”
71. Rasmussen Report conducted a national telephone survey of a random sample of 1000 U.S. adults from June 19 to 20, 2013. Results indicated that 63% of adults nationwide would agree with the statement “Most Americans want the government to have less power and money.”
- Use the information from the report to calculate a 95% confidence interval for the proportion of Americans who would agree with the statement above. Restate your confidence interval in terms of percentages. What is the margin of error?
- The report concluded with the following statement: “The margin of error is ±3% with a 95% level of confidence.” Compare this statement with the margin of error you calculated in part (a).
- Was a sample of size 1000 sufficiently large to guarantee that the margin of error was less than 3% even if the sample percentage had been as low as 50% or as high as 80%? Explain.
- How large a sample size was needed to guarantee that the margin of error was below 3% regardless of the sample proportion?
Algebra Review Appendix
Solving for One Variable in Terms of Another
71.
(a) ; from approximately 0.60 to 0.66, or from 60% to 66%. The margin of error, to two decimals, is 0.03 or ±3%. (It was 3.05%, which we rounded to 3%.)
(b) They match if rounded to the nearest whole percent.
(c) Corresponding to 50%: margin of error is . So, the margin of error would be 3% only if we round to the nearest whole percent.
Corresponding to 80%, margin of error is , or approximately 2.5%.
(d) Solve for ; . In order to guarantee that the margin of error was less than 3%, a sample size of at least 1112 should be used.