7.6 7.5 Experiments
Sample surveys gather information on part of the population to make conclusions about the whole. When the goal is to describe a population, statistical sampling is the right tool to use.
Suppose, however, that we want to study the response to a stimulus, to see how one variable affects another when we change existing conditions. For example:
- Will a new mathematics curriculum improve the scores of sixth-graders on a standardized test of mathematics achievement?
- Will taking small amounts of aspirin daily reduce the risk of suffering a heart attack?
- Does a woman’s smoking during pregnancy reduce the IQ of her child?
Studies that simply observe and describe are ineffective tools for answering these questions. Experiments give us clearer answers.
Experiment DEFINITION
An experiment deliberately imposes a treatment on individuals to observe their responses. The purpose of an experiment is to study whether the treatment causes a change in the response.
Experiments are the preferred method for examining the effect of one variable on another. By imposing the specific treatment of interest and controlling other influences, we can pin down cause and effect. A sample survey may show that two variables are related, but it cannot demonstrate that one causes the other. Statistics has something to say about how to arrange experiments, just as it suggests methods for sampling.
306
EXAMPLE 9 An Uncontrolled Experiment
A college regularly offers a review course to prepare candidates for the Graduate Management Admission Test (GMAT) required by most graduate business schools. However, one year the college decided to offer only an online version of the course. The average GMAT score of students in the online course was 10% higher than the longtime average of those who took the classroom review course. Can we conclude that the online course is more effective?
This experiment has a very simple design. A group of subjects (the students) were exposed to a treatment (the online course), and the outcome (GMAT scores) was observed. The design can be represented as
or, in general form, as
Most laboratory experiments use a design like that in Example 9: Apply a treatment and measure the response. In the controlled environment of the laboratory, simple designs often work well. But field experiments and experiments with human subjects have more sources of variability that can influence the outcome. With greater variability comes a greater need for statistical design, as we will see in Example 10.
A closer look at the GMAT review course showed that the students in the online review course were indeed quite different from the students who took the classroom course in past years. In particular, they were older and more likely to be employed. An online course appeals to these mature people, but we can’t compare their performance with that of the undergraduates who previously dominated the course. The online course might even be less effective than the classroom version for these students. The effect of online versus in-class instruction is hopelessly mixed up with influences lurking in the background, and this entanglement is displayed in Figure 7.2.
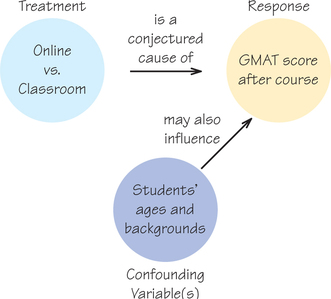
We say that student age and background are confounded with whatever effect the change to online instruction may have. In everyday usage, someone who is confounded is confused or mixed up. In statistics, confounded variables have their effects mixed together so that it’s hard to tell what effect is due to each variable separately.
307
Confounding DEFINITION
Variables are said to be confounded when their effects on the outcome (response or dependent variable) cannot be distinguished from each other. Such variables may or may not have been intended to be part of the study.
Self Check 6
A researcher is studying the effect of food (or lack of food) on college students’ ability to perform well on math tests. In a math course, students were asked if they had eaten food within the last hour and were then given a math test. The researcher found that, on average, students who had eaten within an hour before the test did better than students who had not eaten. Explain how another variable described as “had a class right before math class” could be confounded with the variable “ate within an hour of math class.”
(a) The distribution is normal and thus it is bell-shaped.
(b) The mean is 0.7.
(c) The standard deviation is .
(d) The distribution is still normal, but its center is shifted to the right compared to the distribution in Example 16. In addition, its standard deviation is slightly smaller.
The remedy for confounding is to do a comparative experiment (sometimes called a quasiexperiment) in which some students are taught in the classroom and other similar students take the course online. The first group is called a control group (because that is the mode of instruction that had been the norm). Most well-designed experiments compare two or more treatments. Of course, comparison alone isn’t enough to produce results we can trust. If the treatments are given to groups that differ markedly when the experiment begins, bias will result. For example, if we allow students to choose whether they get online or classroom instruction, older employed students are likely to sign up for the online course. Personal choice will bias our results in the same way that volunteers bias the results of call-in opinion polls. The solution to the problem of bias is the same for experiments and for samples: Use impersonal chance to select the groups.
EXAMPLE 10 A Randomized Comparative Experiment
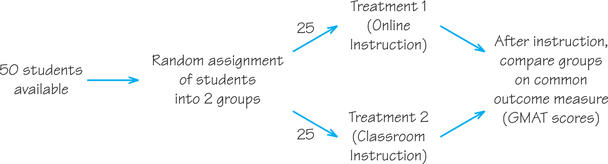
A college decides to compare the progress of 25 students taught in the classroom with that of 25 students taught the same material online. They select which students will be taught online by taking a simple random sample of size 25 from the 50 available students. The remaining 25 students form the control group. They will receive classroom instruction. The result is a randomized comparative experiment with two groups. Figure 7.3 outlines the design in graphical form.
308
The selection procedure of randomly assigning students to groups is exactly the same as it is for sampling:
- Step 1. Label the 50 students 01 to 50.
- Step 2. Go to the table of random digits (Table 7.1, page 298) and read successive two-digit groups. Skip over two-digit groups greater than 50 since these values are not used as labels. Also skip over any duplicates. For example, if you begin at line 106 in Table 7.1, the first five students chosen are those labeled 41, 50, 13, 15, and 27.
- Step 3. Stop when you have selected 25 labels. The students corresponding to these 25 labels form the online group.
If you prefer, you can skip Steps 2 and 3 and use technology as outlined in Spotlight 7.1 (page 300) to randomly select the 25 labels for the Treatment 1 group. Here is the output using a Ti-84 graphing calculator and the randintNoRep command to select the labels for the Treatment 1 group sample:
The GMAT experiment is comparative because it compares two treatments (the two instructional settings). The experiment could have even had a third treatment if there had been a “hybrid” (part-classroom, part-online) course option. It is randomized because the subjects are assigned to the treatments by chance. Randomization creates groups that are similar to each other before we start the experiment. Possible confounding variables act on both groups at once, so their effects tend to balance out and do not greatly affect the results of the study. The only difference between the groups is the online versus in-class experience. So if we see a difference in performance, it must be due to the different setting. That is the basic logic of randomized comparative experiments. This logic shows why experiments can give good evidence that the different treatments really caused different outcomes.
There is a fine point: The performance of the two groups will differ even if the treatments are identical. That’s because the individuals assigned at random to the groups differ. It is only differences larger than would plausibly occur just by chance that show the effects of the treatments. The laws of probability (discussed in Section 8.1) allow statisticians to say how big of an effect is statistically significant. You probably understand this concept intuitively because you would not find it unusual if all the children were girls in a family with two or three children, but you probably would in a family with six or more children. We now present a convention that assigns a concrete numerical benchmark to this intuitive gut feeling.
Statistically Significant DEFINITION
An observed effect that is so large that it would rarely occur by chance is called statistically significant. (“Rarely” usually means less than 5% of the time.)
Although experiments provide the best way to establish cause and effect, ethical considerations, such as those discussed in Spotlight 7.3, prevent some experiments from being conducted.
309
Ethics in Experiments Spotlight 7.3
The last century saw some unethical experiments; for instance, look up the painful and deadly medical experiments done by the Nazis during World War ii or the sexually transmitted disease experiments conducted by the United States in Guatemala (1946–1948) and in Tuskegee, Alabama (1932–1972).
The Tuskegee experiment, conducted by the U.S. Public Health Service, studied the natural progression of untreated syphilis in African American men. The men in the study, all impoverished sharecroppers, believed they were receiving free healthcare from the U.S. government. Those who had contracted syphilis before the study were not told that they had the disease, and in 1947, when treatment with penicillin became available, they were not treated. Prompted in part by the Tuskegee syphilis study, the Belmont Report (released in 1979) proposed ethical principles and guidelines for research involving human subjects. Today, there is great emphasis on having studies approved by an institutional Review Board (iRB) and on following ethical codes such as those outlined in the Belmont Report. Key principles of ethics codes include the following:
- Voluntary participation
- Informed consent
- The right to quit at any time
- The avoidance of unnecessary suffering or risk
Also, when randomized clinical trials accumulate enough evidence to make clear that a treatment is dangerous or is less effective than another, there is a mechanism to stop the data-gathering process before the originally scheduled end of the experiment.
For some experiments, however, giving the subject full disclosure about the true purpose of the experiment could prevent researchers from obtaining accurate data. in such cases, an iRB may give the researcher permission to (at least temporarily) withhold a piece of information from participants. Consider this example. An internet field experiment conducted by Andrew Hanson and Michael Santas (whose results were published in the July 2014 issue of Southern Economic Journal) investigated discrimination against Hispanics in the U.S. housing market. Hispanics were divided into two groups: recent immigrants and those who were assimilated into American culture. Responses from (fictitious) Hispanics who were portrayed as recent immigrants got significantly fewer callbacks and invitations to showings of apartments than did otherwise identical responses from (fictitious) Whites or Hispanics who were portrayed as assimilated into American culture. While landlords may not be willing to acknowledge their prejudices, this method of research was able to yield an accurate assessment of prejudice in the rental market in metropolitan areas of the United States.