Chapter 8 Exercises
Chapter 8 Exercises
8.1 Random Phenomena and Probability
Question 8.32
1. Identify three random phenomena that occur in your life.
1.
Sample response: The time it takes to get from the dorm to this class each day; the outside temperature when I wake up in the morning; the number of chocolate chips in a cookie from the student center.
Question 8.33
![]() 2. Random phenomena can’t be predicted for certain in the short term but exhibit regular patterns in the long term. Which of the data sets in parts (a) through (d) do not appear to be from the random phenomena of coin tossing? Explain.
2. Random phenomena can’t be predicted for certain in the short term but exhibit regular patterns in the long term. Which of the data sets in parts (a) through (d) do not appear to be from the random phenomena of coin tossing? Explain.
390
- H T H T H T H T H T H T H T H T H T H T H T H T
- T T T T H H H H T T T T H H H H T T T T
- H H T H H T T H H H H T H T H H T T T T H H H H
- T H H T T H H T T H H T T H H T T H H T T H H T
Question 8.34
3. (a) Hold a penny upright on its edge under your forefinger on a hard surface, and then snap it with your other forefinger so that it spins for some time before falling. Based on 50 spins, estimate the probability of heads.
(b) Toss a thumbtack with a gently curved back (similar to Figure 8.4, page 344) on a hard surface 100 times. (To speed up the process, toss 10 at a time.) How many times did it land with the point up? What is the approximate probability of landing point up?
3.
(a) Results will vary, but the probability of a head is usually greater than 0.5 when spinning pennies. One possible explanation is the “bottle cap effect.” The rim on a penny is slightly wider on the head side, so just as spinning bottle caps almost always fall with the open side up, pennies fall more often with the head side up. Additional results will vary.
(b) Sample response: In 54 of the 100 tosses, the tack landed point up. Hence, the estimated probability is 0.54.
Question 8.35
4. Suppose there is a forecast of a 70% chance of rain. Using the “long run” interpretation of the definition of probability, if it does not rain the next day, is it appropriate to say that the forecaster was “wrong”? Explain.
Question 8.36
5. The table of random digits (Table 7.1, page 298) was produced by a random mechanism that gives each digit probability 0.1 of being a 0. What proportion of the first five lines in the table are 0s? This proportion is an estimate of the true probability, which in this case is known to be 0.1.
5.
The first five lines contain 200 digits, of which 21 are 0s. The proportion of 0s is (see the table on next page).
In Exercises 6–8, describe a reasonable sample space for the random phenomena mentioned. In some cases, you must use judgment to choose a reasonable .
Question 8.37
6. A student is randomly chosen from a large mathematics class.
- Ask if the subject is male or female.
- Ask if the student lives on or off campus.
- Ask how tall the student is.
- Ask how much money the student is carrying in change.
Question 8.38
7. A basketball player shoots four free throws.
- You record the sequence of hits and misses.
- You record the number of shots she makes.
7.
(a) We will use H for “hit” and M for “miss” in this exercise.
(b)
Question 8.39
8. A randomly chosen subject (participant) arrives for a study of exercise and fitness.
- The subject is either female or male.
- After 10 minutes on an exercise bicycle, you ask the subject to rate his or her effort on the Rate of Perceived Exertion (RPE) scale. The RPE goes in whole-number steps from 6 (no exertion at all) to 20 (maximal exertion).
- You also measure the subject’s maximum heart rate (beats per minute).
Question 8.40
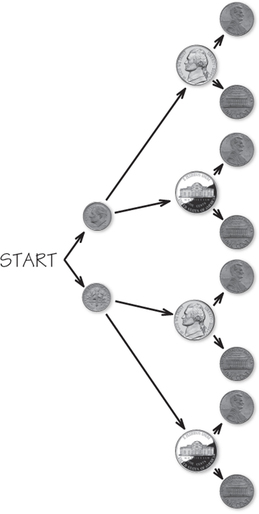
9. Consider flipping a dime, nickel, and penny.
- Why would a tree diagram be a more convenient way than a table to represent the sample space?
- Make a tree diagram, and then use it to write out the sample space.
- Use the diagram to find the probability that at least one of the three coins lands on heads.
9.
(a) It is usually easier to add further branching to a tree than further dimensions to a table.
A-21
| 101 | 19223 | 95034 | 05756 | 28713 | 96409 | 12531 | 42544 | 82853 |
| 102 | 73676 | 47150 | 99400 | 01927 | 27754 | 42648 | 82425 | 36290 |
| 103 | 45467 | 71709 | 77558 | 00095 | 32863 | 29485 | 82226 | 90056 |
| 104 | 52711 | 38889 | 93074 | 60227 | 40011 | 85848 | 48767 | 52573 |
| 105 | 95592 | 94007 | 69971 | 91481 | 60779 | 53791 | 17297 | 59335 |
(b)
(c) There are seven out of the eight outcomes that yield at least one of the three coins landing on heads. Thus, the probability of at least one of the three coins landing on heads is .
Question 8.41
10. At the start of class, an instructor gives a brief quiz on assigned reading. The quiz consists of two questions: a true-or-false question and a multiple-choice question with choices (a), (b), or (c). A student who hasn’t done the assignment guesses at both questions. Use a table to represent the sample space of possible answers for this two-question quiz, and then list the elements in the sample space.
8.2 Basic Rules of Probability
Question 8.42
11. Probability is a measure of how likely an event is to occur. Match one of the probabilities that follow with each statement about an event. (The probability is usually a much more exact measure of likelihood than is the verbal statement.)
- This event is impossible. It can never occur.
- This event is certain. It will occur on every trial of the random phenomenon.
- This event is very unlikely, but it will occur once in a while in a long sequence of trials.
- This event will occur somewhat more often than not.
11.
(a) Probability 0
(b) Probability 1
(c) Probability 0.01, once per 100 trials on average in the long run
(d) Probability 0.6
Question 8.43
12. Based on data from the American Community Survey, a high percentage of U.S. workers drive alone to work (see Tables 8.1 and 8.2, pages 348 and 349). A 2009 survey asked respondents about the number of vehicles they had access to within their household. The results appear below.
| Workers and Vehicles | Frequency |
|---|---|
| Workers in households with zero vehicles | 5, 138, 372 |
| Workers in households exceeds vehicles | 12, 357, 761 |
| Workers in households equals vehicles | 66, 463, 188 |
| Vehicles exceed workers in households | 67, 413, 776 |
| Total | 151, 370, 000 |
391
- Assume that the sample fairly represents workers in the United States. Use the sample proportions in each category as probabilities and create a probability model for Workers and Vehicles (round probabilities to three decimal places).
- Verify that Rule 2 is satisfied.
- Find the probability that there are at least as many vehicles as there are workers in the household. Which probability rule did you use to answer this question?
- Find the probability that the workers in the household have access to at least one vehicle. Which probability rule did you use to answer this question?
Question 8.44
![]() 13. In Spotlight 8.1 (page 345), we noted that a question posed to Blaise Pascal in 1654 by an amateur mathematician launched the formal study of probability. Here’s a simplified version of this “Problem of Points.” Suppose two players are playing a coin flip game where “heads” earns Player A one point and “tails” earns Player B one point. The winner is the first player to reach a total of four points. The game is interrupted with Player A ahead by a score of 3 to 2. Based on the sample space of possible ways that the game can be finished, what would be a fair division of the jackpot money between Players A and B?
13. In Spotlight 8.1 (page 345), we noted that a question posed to Blaise Pascal in 1654 by an amateur mathematician launched the formal study of probability. Here’s a simplified version of this “Problem of Points.” Suppose two players are playing a coin flip game where “heads” earns Player A one point and “tails” earns Player B one point. The winner is the first player to reach a total of four points. The game is interrupted with Player A ahead by a score of 3 to 2. Based on the sample space of possible ways that the game can be finished, what would be a fair division of the jackpot money between Players A and B?
13.
If the next flip is heads, Player A wins; if tails, the two players will be tied and will have to flip the coin again. Thus, the probability of Player A winning is . The probability of Player B winning is . To be fair, Player A should receive of the jackpot money and Player B should receive of the jackpot money.
Question 8.45
14. Choose a young adult (aged 25 to 34 years) at random. The probability is 0.12 that the person chosen did not complete high school, 0.31 that the person has a high school diploma but no further education, and 0.29 that the person has at least a bachelor’s degree.
- What must be the probability that a randomly chosen young adult has some education beyond high school but does not have a bachelor’s degree?
- What is the probability that a randomly chosen young adult has at least a high school education?
Question 8.46
15. While it is a less common way (than probability) of expressing likelihood and does not follow the five basic Probability Rules, statements of “odds” are often encountered in gambling contexts. The odds against an event happening are the ratio . In a horse race, suppose the odds against a particular horse winning the race are 3:2 (or “3 to 2”); in other words, . What is the probability that the horse wins?
Algebra Review Appendix
Solving for One Variable in Terms of Another
15.
We know that . Now, we need to solve the following equation for . This gives .
8.3 Rules of Probability: Independent and Dependent Events
Question 8.47
16. The Punnett square is a diagram that biologists use to determine the probability of offspring having certain genetic makeup. Suppose that represents the gene for brown eyes and represents the gene for blue eyes. In genetics, capital letters refer to dominant traits, so a person receiving both and generally has brown eyes. This diagram shows the possibilities for the child of two parents. Each parent gives the child one of its two genes with equal probability. What is the probability that this child will receive the genetic makeup for brown eyes? Discuss how this relates to Example 2 (page 346).
| Mother gives B | Mother gives b | |
|---|---|---|
| Father gives B | BB | Bb |
| Father gives b | Bb | bb |
Question 8.48
![]() 17. Suppose two events and are mutually exclusive and both have positive probabilities of occurring. Can and also be independent events? Explain.
17. Suppose two events and are mutually exclusive and both have positive probabilities of occurring. Can and also be independent events? Explain.
17.
Mutually exclusive events with positive probabilities cannot be independent. Sample explanation: Suppose and are mutually exclusive with . Since and are mutually exclusive, . But then, , which means that and are dependent events.
Question 8.49
18. Given , , and , determine the following probabilities.
Question 8.50
![]() 19. What is the probability that Laurie rolls a pair of dice and gets an even sum in each of her first three rolls in the game of Monopoly?
19. What is the probability that Laurie rolls a pair of dice and gets an even sum in each of her first three rolls in the game of Monopoly?
19.
The three events of tossing a pair of dice are independent events. The probability of rolling an even sum is 1/2 (there are 18 out of 36 ways to roll an even sum). Because there are three independent events, the probability that she will roll an even sum three times is (1/2)(1/2)(1/2) = 1/8 = 0.125.
Question 8.51
20. If you are in the championship round of a tournament and you are better than your opponent, are you better off having the championship determined by playing a single game or by playing a two-out-of-three- game series? You might try intuition, simulation, or a tree diagram.
Question 8.52
21. Return to the probability model that you created for Workers and Vehicles in Exercise 12. Suppose a random sample of two U.S. workers is chosen.
- What is the probability that they both live in households where the number of vehicles exceeds the number of workers in the household?
- What is the probability that they both live in households where the number of vehicles does not exceed the number of workers in the household?
392
21.
Let , and
(a)
(b)
Exercises 22–24 are based on data from the 2013 March Supplement of the U.S. Census Bureau’s Current Population Survey.
Question 8.53
22. According to the 2013 March Supplement Survey, 22.3% of U.S. households are in the Midwest. In addition, 9.6% of households earn $75,000 or more per year and are located in the Midwest. Determine the probability that a randomly selected American household earns $75,000 or more per year, given that the house is located in the Midwest.
Question 8.54
23. According to the 2013 March Supplement Survey, 32.0% of U.S. households are in the South. In addition, 7.9% of households earn $100,000 or more per year and are located in the South. Determine the probability that a randomly selected Southern household earns $100,000 or more per year.
23.
. Approximately 24.7% of Southern households earn $100,000 or more per year.
Question 8.55
24. According to the 2013 March Supplement Survey, 18.8% of U.S. households are in the Northeast. In addition, 21.2% of Northeastern households earn $75,000 or more per year. What percentage of households earn $75,000 or more per year and are located in the Northeast?
Question 8.56
![]() 25. Each year, the study Monitoring the Future: A Continuing Study of American Youth surveys twelfth-grade students on a wide range of topics related to behaviors, attitudes, and values. One of the survey questions asks students to identify their sex. Another question asks students to rate their intelligence compared with others their age. Assume that the sample used in this survey is representative of twelfth-grade students. Here are some of the results from the more than 13,000 students who participated in the survey: 49.8% were male; 50.2% were female; 60.3% of the females rated their intelligence as above average; 68.6% of the males rated their intelligence as above average. Since the number of participants in the survey was large, the survey percentages should be close to the probabilities for the population of twelfth-grade students.
25. Each year, the study Monitoring the Future: A Continuing Study of American Youth surveys twelfth-grade students on a wide range of topics related to behaviors, attitudes, and values. One of the survey questions asks students to identify their sex. Another question asks students to rate their intelligence compared with others their age. Assume that the sample used in this survey is representative of twelfth-grade students. Here are some of the results from the more than 13,000 students who participated in the survey: 49.8% were male; 50.2% were female; 60.3% of the females rated their intelligence as above average; 68.6% of the males rated their intelligence as above average. Since the number of participants in the survey was large, the survey percentages should be close to the probabilities for the population of twelfth-grade students.
Use probability notation to express each of the percentages above as probabilities.
Find the following probabilities for parts (b) through (e), rounding answers to three decimal places.
- P(female and above average)
- P(male and above average)
- P(above average)
- P(female | above average)
- Suppose a twelfth-grade student is selected at random. Does knowing that the student rated his or her own intelligence as above average increase, decrease, or have no effect on the probability that the student is female? Explain.
25.
(a)
(b)
(c)
(d)
(e)
(f) The probability that a randomly selected student is female is 0.502. On the other hand, if you know that the student rated his/her intelligence as above average, then the probability that the student is female decreases to 0.470.
Question 8.57
![]()
![]() 26. The concern over drug use among teens has prompted some schools to consider mandatory drug testing of its students. However, schools should be warned that drug tests, while generally reliable, are not perfect. Sometimes a person who does use drugs gets a negative result (a false negative). Sometimes a person who does not use drugs tests positive (a false positive). Companies that produce tests for drugs usually provide information on two characteristics of their test: , the probability that their test correctly identifies a drug user, and , the probability that it correctly reports the absence of drugs.
26. The concern over drug use among teens has prompted some schools to consider mandatory drug testing of its students. However, schools should be warned that drug tests, while generally reliable, are not perfect. Sometimes a person who does use drugs gets a negative result (a false negative). Sometimes a person who does not use drugs tests positive (a false positive). Companies that produce tests for drugs usually provide information on two characteristics of their test: , the probability that their test correctly identifies a drug user, and , the probability that it correctly reports the absence of drugs.
Suppose that a large high school is considering a mandatory drug testing program. The particular test under consideration correctly identifies 95% of the users and correctly reports the absence of drugs in 90% of the nonusers .
- Suppose 25% of the students are drug users. Draw a tree diagram similar to Figure 8.15 in Example 10 (page 359). What percentage of the positive test results will be from users?
Suppose 2% of the students use drugs.
What percentage of positive tests will be from users? What does this imply about the rest of the positive tests?
8.4 Discrete Probability Models
Question 8.58
27.Table 8.10 gives a probability model for total household income.
| Total Household Income | Probability |
| Under $25,000 | 0.174 |
| $25,000 to $49,999 | 0.218 |
| $50,000 to $74,999 | 0.185 |
| $75,000 to $99,999 | 0.140 |
| $100,000 or over | 0.283 |
393
- Check to see whether the probability model in Table 8.10 is legitimate. Explain what you checked.
- What makes the probability model in Table 8.10 a discrete probability model?
- What is the probability that a randomly chosen household will have a total income less than $50,000?
- What is the probability that a randomly chosen household will have a total income less than $100,000?
- Suppose two U.S. households were randomly selected. What is the probability that both households will have a total income less than $100,000?
27.
(a) The probabilities were all between 0 and 1 inclusive, and the sum of the probabilities is 1. Hence, the probability model is legitimate.
(b) The model is discrete because there are only five possible categories for outcomes.
(c)
(d)
(e)
A-22
Question 8.59
![]() 28. Role-playing games like Dungeons & Dragons use many different types of dice. One type of die has a tetrahedral (pyramidal) shape with four triangular faces (see Figure 8.27). Each triangular face has a number (1, 2, 3, or 4) next to each of its edges. Because the top of this die is not a face but a point, the way to read it is by the number at the top of the face that is visible when the die comes to rest. Suppose that the intelligence of a character is determined by rolling this four-sided die twice and adding 1 to the sum of the results.
28. Role-playing games like Dungeons & Dragons use many different types of dice. One type of die has a tetrahedral (pyramidal) shape with four triangular faces (see Figure 8.27). Each triangular face has a number (1, 2, 3, or 4) next to each of its edges. Because the top of this die is not a face but a point, the way to read it is by the number at the top of the face that is visible when the die comes to rest. Suppose that the intelligence of a character is determined by rolling this four-sided die twice and adding 1 to the sum of the results.
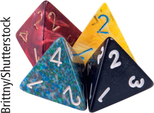
- Give a probability model for the character’s intelligence. (Start with a display in the style of Figure 8.7 on page 347, adapted for the outcomes of the two rolls of the four-sided die. These outcomes are equally likely.)
- What is the probability that the character has intelligence 7 or higher?
Question 8.60
29.
 North Carolina State University posts the grade distributions for its courses online. Students in Statistics 101 in a recent semester earned 21% As, 43% Bs, 30% Cs, 5% Ds, and 1% Fs. Here is the probability model for the grade of a randomly chosen Statistics 101 student.
| Grade | |||||
|---|---|---|---|---|---|
| Probability | 0.01 | 0.05 | 0.30 | 0.43 | 0.21 |
- Make a probability histogram for this model. Does it have the shape of a normal distribution?
- What is the probability that the student got a grade of B or better?
29.
(a) Here is the probability histogram:
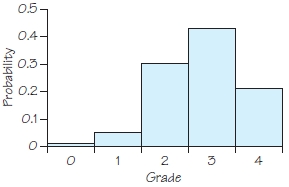
The histogram does not look to be normally distributed.
(b)
Question 8.61
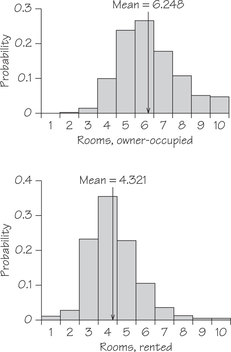
![]() 30. How do rented housing units differ from units occupied by their owners? Here are probability models for the number of rooms for owner-occupied units and renter-occupied units, according to the Census Bureau:
30. How do rented housing units differ from units occupied by their owners? Here are probability models for the number of rooms for owner-occupied units and renter-occupied units, according to the Census Bureau:
| # of Rooms | 1 | 2 | 3 | 4 | 5 |
|---|---|---|---|---|---|
| Owned | 0.000 | 0.001 | 0.014 | 0.099 | 0.238 |
| Rented | 0.011 | 0.027 | 0.229 | 0.348 | 0.224 |
| # of Rooms | 6 | 7 | 8 | 9 | 10 |
| Owned | 0.266 | 0.178 | 0.107 | 0.050 | 0.047 |
| Rented | 0.105 | 0.035 | 0.012 | 0.004 | 0.005 |
Make probability histograms of these two models, using the same scale. What are the most important differences between the models for owner-occupied and rented housing units?
Question 8.62
31. In each of the following situations, state whether or not the given assignment of probabilities to individual outcomes is legitimate—that is, satisfies the rules of probability. If not, give specific reasons for your answer.
- Choose a college student at random and record gender and enrollment status: , , , .
- Choose a college student at random and record the season of that student’s birth: , , , .
31.
(a) Not legitimate: The probabilities are between 0 and 1, but the sum is greater than 1. Rule 2 is violated.
(b) Legitimate: The probabilities are between 0 and 1, inclusively, and have sum 1.
One may find it surprising that no student surveyed was born in fall, but that outcome is possible.
Question 8.63
32. What is the probability that a housing unit has five or more rooms? Use the models in Exercise 30 to answer this question for both owner-occupied and rented units.
Question 8.64
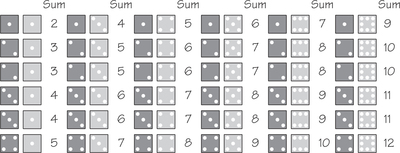
![]() 33. Balanced six-sided dice with altered labels can produce interesting distributions of outcomes. Construct the probability model (sample space and assignment of probabilities for each sum) for rolling the dice that is featured in Joseph Gallian’s article “Weird Dice” in the February 1995 issue of Math Horizons. Instead of using the regular values {1, 2, 3, 4, 5, 6}, one die has the labels 1, 2, 2, 3, 3, 4, and the other die has the labels 1, 3, 4, 5, 6, 8. How does this model compare with the model for regular dice?
33. Balanced six-sided dice with altered labels can produce interesting distributions of outcomes. Construct the probability model (sample space and assignment of probabilities for each sum) for rolling the dice that is featured in Joseph Gallian’s article “Weird Dice” in the February 1995 issue of Math Horizons. Instead of using the regular values {1, 2, 3, 4, 5, 6}, one die has the labels 1, 2, 2, 3, 3, 4, and the other die has the labels 1, 3, 4, 5, 6, 8. How does this model compare with the model for regular dice?
33.
Like tossing a pair of standard dice, the sample space contains sums between 2 and 12 from the 36 possible outcomes of rolling this pair of “weird dice.” (See bottom of this page.) The probability for each sum is the same as the pair of standard dice.
| Outcome | 2 | 3 | 4 | 5 | 6 | 7 | 8 | 9 | 10 | 11 | 12 |
| Probability |
8.5 Equally Likely Outcomes
Question 8.65
34. If you play the lottery, there are two possibilities— you could either win or not win. Explain whether or not this means that you have a 1 out of 2 chance (i.e., a 50% probability) of winning.
394
Question 8.66
35. A party host gives a door prize to one guest chosen at random. There are 42 men and 48 women at the party. What is the probability that the prize goes to a woman?
35.
All 90 guests are equally likely to get the prize, so
Question 8.67
36. At a party a cooler is filled with cans of drinks: 12 Cokes, 6 Diet Cokes, 4 lime seltzers, and 8 lemon seltzers. You grab a can from the cooler at random.
- What is the probability that you grabbed either a Coke or Diet Coke?
- Before you look at the can, your friend says, “I didn’t know you drank seltzer.” Given this information, what is the probability that you have grabbed your least favorite drink, a lime seltzer?
Question 8.68
37. Suppose you have 10 books in a stack but you only have space for five books on your bookshelf.
- In how many different ways can you select five books from the stack and arrange them in the empty space on your bookshelf?
- How many different selections of five books can you make? (Don’t worry about how you will arrange the books.)
37.
(a)
(b)
Question 8.69
38. Abby, Boaz, Carmen, Dani, and Eduardo work in a firm’s public relations office. Their employer must choose two of them to attend a conference in Paris. To avoid unfairness, the choice will be made by drawing two names from a hat. (This is an SRS of size 2.)
- Write down the sample space of all possible choices of two of the five names.
- The random drawing makes all choices equally likely. What is the probability of each choice?
- What is the probability that Abby is chosen?
- What is the probability that neither of the two men (Boaz and Eduardo) is chosen?
Question 8.70
39. You toss a balanced coin 10 times and write down the resulting sequence of heads and tails, such as HTTTHHTHHH.
- How many possible outcomes are there for the 10 tosses?
- What is the probability that your 10-toss sequence is either all heads or all tails?
39.
(a)
(b)
Question 8.71
40. In the Texas Hold ‘Em style of poker, play begins with each player being dealt two cards face down. From a standard 52-card deck, how many possible 2-card hands could be dealt to you?
Question 8.72
41. A computer assigns three-character log-in IDs that may contain the digits 0 to 9 as well as the letters to , with repeats allowed.
- What is the probability that your ID contains no ?
- What is the probability that your ID contains no digits?
41.
(a) There are different codes. The probability of no is as follows:
(b) The probability of no digits is as follows:
Question 8.73
42. Consider a typical combination lock on a locker or briefcase.
- If you ask for the three numbers in the combination needed to open the lock, and they are given to you in order from smallest to largest as 3–5–8, why is this not enough information to open the lock?
- What would be the probability that you could open the lock with one try?
- Is such a combination lock accurately named, or is it really a “permutation lock”?
Question 8.74
43. You may have heard that a monkey hitting keys at random on a typewriter keyboard for an infinite amount of time could eventually type a particular chosen text, such as the complete works of Shakespeare. Let’s focus on a monkey who just types the letters , and in random order in three-letter sequences.
- How many possible three-letter “words” can the monkey type using only these letters?
- Which of these are words in an English dictionary?
- What is the probability that the word the monkey typed is in an English dictionary?
43.
(a) The possibilities are aps, asp, pas, psa, sap, spa.
(b) Asp, pas, sap, and spa are English words.
(c) The probability is . The answer can also be expressed as exactly or approximately 66.7%.
Question 8.75
![]() 44. Mozart composed a 16-bar Viennese minuet (“Musical Dice Game”) in which bars 1 through 7 each have 11 choices, bar 8 has 2, bars 9 through 15 each have 11, and bar 16 has 1. How many possible versions of this minuet are there?
44. Mozart composed a 16-bar Viennese minuet (“Musical Dice Game”) in which bars 1 through 7 each have 11 choices, bar 8 has 2, bars 9 through 15 each have 11, and bar 16 has 1. How many possible versions of this minuet are there?
Question 8.76
![]() 45. In poker, a royal flush is a five-card hand containing (in any order) an ace, king, queen, jack, and 10, all of the same suit.
45. In poker, a royal flush is a five-card hand containing (in any order) an ace, king, queen, jack, and 10, all of the same suit.
- How many royal flush hands are possible?
- What is the number of five-card hands possible from a 52-card deck?
- What is the probability that five cards drawn at random from a 52-card deck will yield a royal flush?
45.
(a) There are four possible royal flush hands.
(b) There are possible five-card hands.
(c) The probability would be
Question 8.77
![]() 46. The King James Version of the Old Testament has its 39 books canonized in a different order than the Hebrew Bible does. What mathematical expression would yield the number of possible orders of these 39 books? Is this number larger than you expected?
46. The King James Version of the Old Testament has its 39 books canonized in a different order than the Hebrew Bible does. What mathematical expression would yield the number of possible orders of these 39 books? Is this number larger than you expected?
Question 8.78
![]() 47. Use technology (see Spotlight 8.3, page 369) for this exercise. A university IT department receives a shipment of 30 printers—20 are inkjet printers and 10 are laser printers. A particular technician randomly chooses 7 of the printers to process (check that it works, tag the printer, etc.). What is the probability that exactly 4 of the printers are inkjets and 3 are laser printers (we’ll call this event )?
47. Use technology (see Spotlight 8.3, page 369) for this exercise. A university IT department receives a shipment of 30 printers—20 are inkjet printers and 10 are laser printers. A particular technician randomly chooses 7 of the printers to process (check that it works, tag the printer, etc.). What is the probability that exactly 4 of the printers are inkjets and 3 are laser printers (we’ll call this event )?
47.
There are ways to select the 4 inkjet and 3 laser printers. Therefore,
395
8.6 Continuous Probability Models
Question 8.79
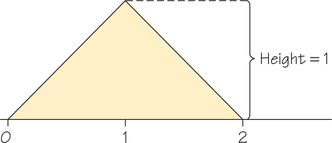
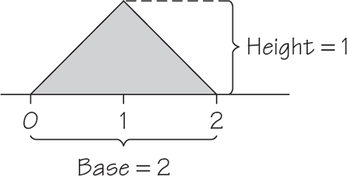
48. Books on reserve at a university library can be checked out for at most 2 hours. The density curve for the amount of time the book is checked out is the shaded triangle shown in Figure 8.28.
- Explain why Figure 8.28 satisfies the definition of a density curve.
- What is the probability that the book is checked out for less than 1 hour?
- What is the probability that the book is checked out for more than 1 hour?
Question 8.80
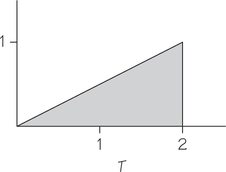
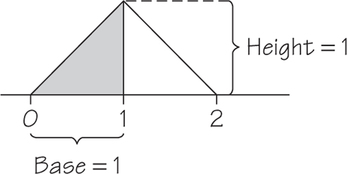
49. Generate two random real numbers between 0 and 1 and take their sum. The sum can take any value between 0 and 2. The density curve is the shaded triangle shown in Figure 8.29.
- Verify by geometry that the area under this curve is 1.
- What is the probability that the sum is less than 1? Sketch the density curve, shade the area that represents the probability, and then find that area.
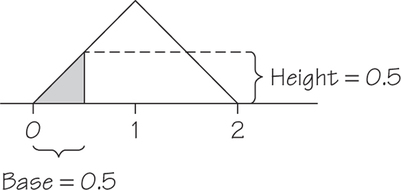
- What is the probability that the sum is less than 0.5? Sketch the density curve, shade the area that represents the probability, and then find that area.
49.
(a)
(b) The probability is 1/2 by symmetry or finding the area:
(c) The area representing this event is
A-23
Question 8.81
50. Suppose two data values are each rounded to the nearest whole number. Make a density curve for the sum of the two roundoff errors, assuming each error has a continuous uniform distribution. (Exercise 49 might help.)
Question 8.82
51. On the TV show The Price Is Right, the “Range Game” involves a contestant being told that the suggested retail price of a prize lies between two numbers that are $600 apart. The contestant has one chance to position a red window with a span of $150 that will contain the price. On one episode, the price of a piano is between $8900 and $9500. If we assume a uniform continuous distribution (i.e., that all prices within the $600 interval are equally likely), what is the probability that the contestant will be successful?
51.
The probability would be .
8.7 The Mean and Standard Deviation of a Probability Model
Question 8.83
52. You have a campus errand that will take only 15 minutes. The only parking space anywhere nearby is a faculty-only space, which is checked by campus police about once every hour. If you’re caught, the fine is $25.
- Give the probability model for the money that you may or may not have to pay.
- What’s the expected value of the money that you will pay for your unauthorized parking?
Question 8.84
53.
Exercise 29 gives a probability model for the grade of a randomly chosen student in Statistics 101 at North Carolina State University, using the 4-point scale. What is the mean grade in this course? What is the standard deviation of the grades?
53.
The mean is as follows:
The variance is calculated as follows:
.
Question 8.85
54. In Exercise 28, you gave a probability model for the intelligence of a character in a role-playing game. What is the mean intelligence for these characters?
Question 8.86
55. Exercise 30 gives probability models for the number of rooms in owner-occupied and rented housing units. Find the mean number of rooms for each type of housing. Make probability histograms for the two models and mark the mean on each histogram. You see that the means describe an important difference between the two models: Owner-occupied units tend to have more rooms.
55.
The mean for owner-occupied units is
The mean for rented units is
Question 8.87
56. Typographical and spelling errors can be either “nonword errors” or “word errors.” A nonword error is not a real word, as when “the” is typed as “teh.” A word error is a real word, but not the right word, as when “lose” is typed as “loose.” When undergraduates write a 250-word essay (without checking spelling), the number of nonword errors has the following probability model:
| Errors | 0 | 1 | 2 | 3 | 4 |
| Probability | 0.1 | 0.2 | 0.3 | 0.3 | 0.1 |
396
The number of word errors has the following model:
| Errors | 0 | 1 | 2 | 3 |
| Probability | 0.4 | 0.3 | 0.2 | 0.1 |
- What is the mean number of nonword errors in an essay?
- What is the mean number of word errors in an essay?
- How does the difference between the means describe the difference between the two models?
Question 8.88
57. Find the mean for the following probability models. Explain how you determined your answers.
- The continuous probability model in Exercise 49
- The probability model in Exercise 50
57.
(a) Model has mean 1, because density curve is symmetric about 1.
(b) Model has mean 0, because density curve is symmetric about 0.
Question 8.89
![]() 58. The idea of insurance is that we all face risks that are unlikely but carry a high cost. Think of a fire destroying your home. Insurance spreads the risk: We all pay a small amount, and the insurance policy pays a large amount to those few of us whose homes burn down. An insurance company looks at the records for millions of homeowners and sees that the mean loss from fire in a year is per person. (The great majority of us have no loss, but a few lose their homes. The $250 is the average loss.) The company plans to sell fire insurance for $250 plus enough to cover its costs and profit. Explain clearly why it would be unwise to sell only 12 policies. Then explain why selling thousands of such policies is a safe business.
58. The idea of insurance is that we all face risks that are unlikely but carry a high cost. Think of a fire destroying your home. Insurance spreads the risk: We all pay a small amount, and the insurance policy pays a large amount to those few of us whose homes burn down. An insurance company looks at the records for millions of homeowners and sees that the mean loss from fire in a year is per person. (The great majority of us have no loss, but a few lose their homes. The $250 is the average loss.) The company plans to sell fire insurance for $250 plus enough to cover its costs and profit. Explain clearly why it would be unwise to sell only 12 policies. Then explain why selling thousands of such policies is a safe business.
Question 8.90
![]() 59. A company is considering offering an extended warranty on new washing machines. The company looks at past repair records and determines that there are two outcomes: an 85% probability of needing no repairs, and a 15% probability of needing a $200 repair during the warranty period. To help the company set a price for an extended warranty on new washing machines, determine the mean outcome for this model. This would be the break-even price for a company selling the extended warranties. (The company, of course, will charge more than this in order to make a profit.)
59. A company is considering offering an extended warranty on new washing machines. The company looks at past repair records and determines that there are two outcomes: an 85% probability of needing no repairs, and a 15% probability of needing a $200 repair during the warranty period. To help the company set a price for an extended warranty on new washing machines, determine the mean outcome for this model. This would be the break-even price for a company selling the extended warranties. (The company, of course, will charge more than this in order to make a profit.)
59.
Since , the breakeven price would be $30.
Question 8.91
60. An American roulette wheel has 38 slots numbered 0, 00, and 1 to 36. The ball is equally likely to come to rest in any of these slots when the wheel is spun. The slot numbers are laid out on a board on which gamblers place their bets. One column of numbers on the board contains multiples of 3—that is, 3, 6, 9,…, 36. Joe places a $1 “column bet” that pays out $3 (so he gains $2) if any of these numbers comes up.
- What is the probability model for the outcome of one bet, taking into account the $1 cost of a bet?
- What are the mean and standard deviation for this model?
- Joe has played roulette every day for years. What does the law of large numbers tell us about his results?
Question 8.92
61. This table shows the prizes and respective probabilities for a lottery:
| Net prize | $1,000,000 | $1000 | $100 | $4 |
| Probability |
On average, how much money from a $1 ticket comes back to you in prizes?
61.
A net prize would be what you have after expenses (cost to play, taxes, other fees, etc.). In this exercise, prizes are given as “net” prizes, so it is understood that they include the cost to play the game. The probability of receiving a prize is as follows:
Thus, the probability of not receiving a prize is
We now have
Approximately $0.45 “comes back” in prizes on the $1 ticket.
Question 8.93
![]() 62. A friend cuts your cake into two pieces: one is of the cake and the other is .
62. A friend cuts your cake into two pieces: one is of the cake and the other is .
- If you flip a coin to decide which piece is yours, what is the expected value of the proportion of the original cake that you will get?
More generally, what is the expected value of your share of the cake if the pieces’ proportions are and ?
Question 8.94
![]() 63. On five-choice questions on the SAT, you get 1 point for a correct answer and lose point for a wrong answer.
63. On five-choice questions on the SAT, you get 1 point for a correct answer and lose point for a wrong answer.
- Find the expected value of a completely random guess on such a question. Does guessing in this situation help you, hurt you, or make no difference?
- Suppose you eliminate one of the five choices as definitely not being the correct answer and then randomly guess among the remaining four choices. Does guessing in this situation help you, hurt you, or make no difference?
63.
(a) The expected value on a single question is . Thus, random guessing makes no difference.
(b) The expected value on a single question is now .
Thus, guessing will increase your score on average.
Question 8.95
![]() 64. In August 2006, El Paso had a storm that was called a “500-year flood.”
64. In August 2006, El Paso had a storm that was called a “500-year flood.”
- What is the expected value of the number of 500-year floods in a 1000-year period?
- After the city moved to raise money to guard against such a major flood in the future, a city council representative was quoted as protesting, “But we still have 490 more years to deal with this.” What false assumption was he making?
8.8 The Central Limit Theorem
Question 8.96
65. Newly manufactured automobile radiators may have small leaks. Most have no leaks, but some have one, two, or more. The number of leaks in radiators made by one supplier has mean 0.15 and standard deviation 0.4. The distribution of the number of leaks cannot be normal because only whole-number counts are possible. The supplier ships 400 radiators per day to an auto assembly plant. Take to be the mean number of leaks in these 400 radiators. Over several years of daily shipments, what interval of values will contain the middle 95% of the many values?
65.
95% of all samples have an between . The interval is (0.11, 0.19).
397
Question 8.97
66. The scores of eighth-grade students on the National Assessment of Educational Progress (NAEP) mathematics test in 2007 have a distribution that is approximately normal, with mean and standard deviation .
- Choose one eighth grader at random. What is the probability that his or her score is higher than 281? Higher than 316?
- Now choose an SRS of four eighth graders. What is the probability that their mean score is higher than 281? Higher than 316?
Question 8.98
![]() 67. Antonio measures the alcohol content of whiskey for his Chemistry 101 lab. He actually measures the mass of 5 milliliters (ml) of whiskey—a chemical calculation—and then finds the percentage of alcohol from the mass. The standard deviation of students’ measurements of mass is milligrams (mg). Antonio repeats the measurement three times and records the mean of his three measurements.
67. Antonio measures the alcohol content of whiskey for his Chemistry 101 lab. He actually measures the mass of 5 milliliters (ml) of whiskey—a chemical calculation—and then finds the percentage of alcohol from the mass. The standard deviation of students’ measurements of mass is milligrams (mg). Antonio repeats the measurement three times and records the mean of his three measurements.
- What is the standard deviation of Antonio’s mean result?
- How many times must Antonio repeat the measurement to reduce the standard deviation of to 5 mg? Explain to someone who knows nothing about statistics the advantage of reporting the average of several measurements rather than the result of a single measurement.
67.
(a) The standard deviation of the average measurement is
(b) To cut the standard deviation in half (from 10 mg to 5 mg), we need measurements because is then . Averages of several measurements are less variable than individual measurements, so an average is more likely to give about the same result each time.
Question 8.99
68. In Exercise 60, you found the mean and standard deviation of the outcome of a column bet in roulette. The central limit theorem says that the average outcome of a large number of bets has a distribution that is close to normal.
- What is the 99.7% confidence interval estimate (mean ±3 standard deviations) of a gambler’s average winnings after 100 bets?
- What is the 99.7% confidence interval estimate of a gambler’s average winnings after 1000 bets?
Question 8.100
69. Averages of several measurements are less variable than individual measurements. The true mass of the whiskey sample in Exercise 67 is 4.6 grams, or 4600 mg. Antonio’s measurements have the normal distribution with mean 4600 mg and standard deviation 10 mg. In this case, the mean of his three measurements also has a normal distribution.
- Sketch on the same graph the two normal curves, for individual measurements and for means of three measurements. Figure 8.24 (page 382) is an example of this kind of graph.
- What interval of values covers the middle 95% of Antonio’s individual measurements?
- What interval of values covers the middle 95% of averages of three measurements?
69.
(a)
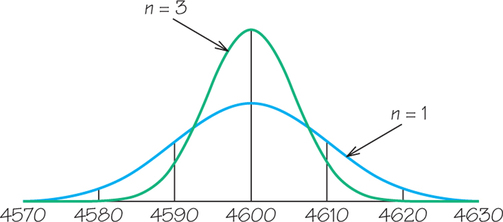
(b) Use the 95 part of the rule with results in the interval (4580, 4620).
(c) Now the standard deviation is 5.77, so we have the following: results in the interval (4588.46, 4611.54).
Question 8.101
70. Exercise 28 gives the probability model for the intelligence assigned by chance to a character in a role-playing game. You found the mean intelligence of such characters in Exercise 54. Jermaine plays this character often. What interval covers (approximately) the middle 68% of average intelligence scores for 100 of Jermaine’s games?
Question 8.102
71. The scores of high school seniors on the ACT college entrance examination in 2010 were roughly normal with mean and standard deviation .
- What is the approximate probability that a single student randomly chosen from all those taking the test scores 26.2 or higher?
- Now take an SRS of nine students who took the test. What are the mean and standard deviation of the sample mean score of these nine students?
- What is the approximate probability that the mean score of these nine students is 26.2 or higher?
71.
(a) Because 26.2 is 1 standard deviation above the mean, the probability is about 0.16.
(b) The mean remains . The standard deviation is .
(c) Because is 3 standard deviations above the mean, the probability is about 0.0015. (This is half of the 0.003 probability for outcomes more than 3 standard deviations from the mean, using the 99.7 part of the 68−95−99.7 rule.)
Question 8.103
![]() 72. Although cities encourage carpooling to reduce traffic congestion, most vehicles carry only one person. For example, 70% of vehicles on the roads in the Minneapolis-St. Paul metropolitan area are occupied by just the driver. You choose 84 vehicles at random.
72. Although cities encourage carpooling to reduce traffic congestion, most vehicles carry only one person. For example, 70% of vehicles on the roads in the Minneapolis-St. Paul metropolitan area are occupied by just the driver. You choose 84 vehicles at random.
- What are the mean and standard deviation of the proportion of vehicles in your sample that carry only one person? (See Chapter 7, Sampling Distribution of a Sample Proportion, page 317.)
- What is the probability that more than 60% of the vehicles in your sample carry only one person?
Question 8.104
73. Among high-performing (and low-performing) schools, there is an unrepresentatively ________ proportion of smaller schools. Explain whether you would complete this sentence with the word “high” or “low,” in light of the formula for the standard deviation of the sampling distribution of the mean.
73.
high; since the standard deviation for a sampling distribution is , smaller schools will have a smaller value for . This will result in more variable means and therefore will be overrepresented in the list of very highest and very lowest performers.
398
Chapter Review
Question 8.105
74. Give either an intuitive or an algebraic argument to explain why .
Question 8.106
75. License plates in Florida have the form A12BCD— that is, a letter followed by two digits followed by three more letters.
- How many possible different license plates are there?
- Jerry would like a plate that ends in AAA. How many such plates are there?
- If license plates are issued at random from all possible plates, what is the probability that Jerry will get a plate that ends in AAA?
75.
(a) There are different license plates of this form.
(b) There are plates ending in AAA because that leaves only the first three characters free.
(c) The probability is .
Question 8.107
76. After you tell Jerry the probability that you calculated in Exercise 75, he realizes that he’s unlikely to get a plate ending in AAA. So he asks you, “What’s the probability I will get a plate in which all four letters are from my name?” These letters are J, E, R, and Y.
- Suppose that Jerry insists that the letters appear in order, so that his plate reads JnmERY, where and stand for any number. What is the probability?
- Suppose Jerry allows his letters to appear in the plate in any order and also allows repeats. What is now the answer to Jerry’s question?
Question 8.108
77. Choose at random a person aged 19 to 25 years and ask, “In the past four days, how many days did you do physical exercise or work out?” Based on a large sample survey, here is a discrete probability model for the answer you will get:
| # of Days | 0 | 1 | 2 | 3 | 4 |
| Probability | 0.61 | 0.17 | 0.10 | 0.08 | 0.04 |
- What is the probability that the person you chose worked out either two or three days in the past four?
- What is the probability that the person you chose worked out at least one day in the past four?
77.
(a) The probability is .
(b) The complement to the event of working out at least one day is working out no days. Thus, using the complement rule, the desired probability is .
Question 8.109
78. Using the information in Exercise 77, what is the mean number of days that randomly chosen 19- to 25-year-olds worked out in the past four days? If you interview many people in this age group, what does the law of large numbers say about the average number of days that these people work out?
Question 8.110
79. Use the information in Exercise 77 and your result from Exercise 78 to answer these questions.
- What is the standard deviation of the number of days in the past four that a randomly chosen 19- to 25-year-old has worked out?
- You interview 100 randomly chosen 19- to 25-year olds. You ask each how many days in the past four he or she has worked out, and you calculate the average number of days. According to the central limit theorem, there is a probability of 0.95 that your average will fall between what two values?
79.
(a) The variance is calculated as follows:
Thus, the standard deviation is days.
(b) The sampling distribution of is approximately normal with and standard deviation . Applying the 68−95−99.7 rule: with probability 0.95, values of x lie in the interval (0.54, 1.00).
Question 8.111
80. In Example 22 (page 378), we saw that a $1 bet on red has a mean outcome of . It turns out not all $1 bets in American roulette have the same mean outcome. The “five-number bet” pays an additional $6 if one of those five numbers comes up—otherwise, the player loses his $1.
- Find the expected value for this five-number bet.
- Is this five-number bet better or worse than a bet on red?
Question 8.112
81. Suppose you select 10 people at random. Find the probability of each event below:
- At least one match in the day of the week that they were born
- At least one match in the day of the month that they were born (assume 31 days per month)
- At least one match in the day of the year that they were born
81.
(a) Because there are only 7 days in the week and 10 people are chosen at random, the probability that there is a match is 100% (certainty).
(b) Assuming 31 days in a month, the probability we seek is
or approximately 80%.
(c) Assuming 365 days in a year, the probability we seek is
or approximately 12%.
Question 8.113
82. In the 1970s, a group of children in Lyme, Connecticut, developed rheumatoid arthritis. However, it took until the 1980s for researchers to determine the cause of their disease, now known as Lyme disease—deer ticks infected with Borrelia burgdorferi. ELISA (enzyme-linked immunosorbent assay) is a commonly administered first test for Lyme disease. It correctly identifies patients with Lyme disease (the test is positive) 93.7% of the time and gives false positive results (the test is positive for patients who do not have Lyme disease) 6% of the time.
- Suppose that in a community in the Northeast, the prevalence of Lyme disease is 0.5%. Given that a person from this community tests positive for Lyme disease, what is the probability that the person actually has Lyme disease?
- Most people are tested only when there is a suspicion that they may have been bitten by a tick. Suppose the prevalence of Lyme disease among those tested is 10%. Given that a person tests positive for Lyme disease, what is the probability that the person actually has Lyme disease?