18.1 Section Title
Eastern Europe faced difficult times in the Great Recession. Yet not all countries suffered the same fate, as we see from this story and from the macroeconomic data presented and discussed in Figure 18-18.
. . . Poland and Latvia . . . inherited woefully deficient institutions from communism and have struggled with many of the same economic ills over the past two decades. They have also adopted staggeringly different approaches to the crisis, one of which was a lot more effective than the other.
. . . I don’t think it’s being radical to say that [since 2004] Poland’s performance is both a lot better and a lot less variable and that if you were going to draw lessons from one of the two countries that it should probably be the country which avoided an enormous bubble and subsequent collapse. What is it that caused Poland’s economy to be so sound? Was it austerity? Was it hard money?
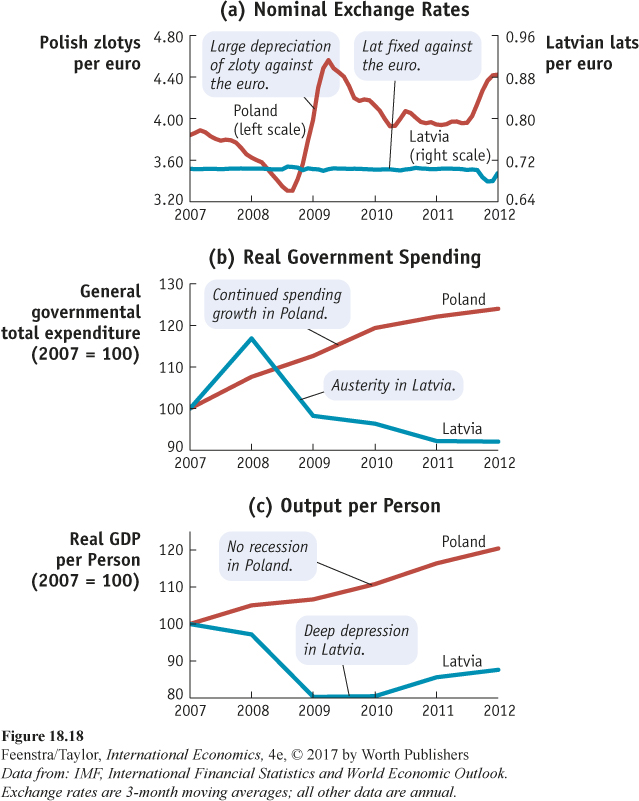
(a) Nominal exchange rates graph shows both polish zloty per euro and Latvian lati per euro in Y-axis for years spanning from 2007 to 2012 in X-axis.
All values are approximate.
- Poland’s nominal exchange rate
2007: 3.80; 2008: 3.60; 2009: 4.10; 2010:4.00; 2011: 3.90; 2012:4.40; - Latvia’s nominal exchange rate
2007:0.70; 2007:0.70; 2007:0.70; 2007:0.70; 2007:0.70; 2012:0.69;
Poland’s graph is labeled “Large depreciation of zloty against the euro.” Latvia’s graph is labeled “Lat fixed against the euro.”
(b) Real Government spending graph has General governmental total expenditure (2007 = 100) in Y-axis with values 90,100,110,120 and 130. For the years shown in X-axis the approximated values are,
- Poland’s government expenditure
2007: 100; 2008: 109; 2009: 112; 2010: 120; 2011: 122; 2012: 124; - Austria’s government expenditure
2007: 100; 2008: 117; 2009: 98; 2010:96; 2011: 93; 2012: 93;
Poland’s graph is labeled “Continued spending growth in Poland.” Latvia’s graph is labeled “Austerity in Latvia.”
(c) Output per person graph has real GDP per person in Y-axis with values 80, 90, 100, 110 and 120 shown across years from 2001 to 1012. Approximated values are
- GDP per person in Poland
2007:100; 2008: 105; 2009: 106; 2010: 110; 2011: 115; 2012: 120;
Poland graph is labeled, “No recession in Poland” - GDP per person in Latvia
2007: 100; 2008: 97; 2009: 80; 2010: 80; 2011:86; 2012: 89;
Latvia graph is labeled, “Deep depression in Latvia”
Text on right side of graph is “Macroeconomic Policy and Outcomes in Poland and Latvia, 2007–12: In the face of adverse demand shocks from outside and inside their economies, Poland and Latvia reacted differently. Panels (a)and (b) show that Poland pursued expansionary monetary policy, let its currency depreciate against the euro, and kept government spending on a stable growth path. Latvia maintained a fixed exchange rate with the euro and pursued an austerity approach with large government spending cuts from 2009 onward. Panel (c) shows that Poland escaped a recession, with positive growth in all years. In contrast, Latvia fell into a deep depression, and real GDP per capita fell 20% from its 2007 peak.
Data from: IMF, International Financial Statistics and World Economic Outlook. Exchange rates are 3-month moving averages; all other data are annual.”
. . . Both Latvia and Poland actually ran rather substantial budget deficits during the height of the crisis, though Latvia’s budgeting in the years preceding the crisis was more balanced and restrained than Poland’s . . . Poland’s government spending as a percentage of GDP was also noticeably higher than Latvia’s both before the crisis and after it . . . You can see how, starting in 2008, Latvia starts to make some sharp cuts while Poland continues its steady, modest increases.
So, basically, Poland is a country whose government habitually ran budget deficits before, during, and after the crisis, whose government spends a greater percentage of GDP than Latvia, and which did not cut spending in response to the crisis. Latvia, in contrast, ran balanced budgets, had a very small government as a percentage of GDP, and savagely cut spending in response to the crisis. While I don’t think you can call Poland “profligate,” if economics really were a morality play you’d expect the Latvians to come out way ahead since they’ve followed the austerity playbook down to the letter. However, in the real world, Poland’s economic performance has been vastly, almost comically, superior to Latvia’s despite the fact that the country didn’t make any “hard choices.”
All of this, of course, leaves out monetary policy . . . Part of the reason that Latvia’s economic performance has been so awful is that it has pegged its currency to the euro, a course of action which has made the lat artificially expensive and which made Latvia’s course of “internal devaluation” necessary . . . Poland did the exact opposite, allowing its currency, the zloty, to depreciate massively against the euro . . .
Poland did not, in other words, “defend the zloty” because it realized that a devaluation of its currency would be incredibly helpful. And the Polish economy has continued to churn along while most of its neighbors have either crashed and burned or simply stagnated. . . .
There are plenty of lessons from Poland’s economic success, including the need for effective government regulation (Poland never had an out-of-control bubble like Latvia), the need for exchange rate flexibility, and the extreme importance of a country having its own central bank. These lessons are neither left wing nor right wing, Poland’s government is actually quite conservative . . . Economics just isn’t a morality play, and no matter how often the Latvians cast themselves as the diligent and upstanding enforcers of austerity their economic performance over the past five years has still been lousy.
Source: Excerpted from Mark Adomanis, “If Austerity Is So Awesome Why Hasn’t Poland Tried It?” forbes.com, January 10, 2013. Reproduced with Permission of Forbes Media LLC © 2013.
Question 1
Question
Using the IS–LM–FX framework, explain how the cut in government spending in Latvia coupled with the fixed exchange rate created a drastic decrease in output.
_
Question 2
Question
Using the IS–LM-FX framework, explain Poland’s performance in the context of the IS–LM–FX framework.
_
Question 3
Question
What do you suppose happened to the trade balance in Latvia? In Poland? Explain.
_