2 Exchange Rates in Practice
Exchange rates fluctuate a lot. Any theory of exchange rate determination must account for this.
1. Exchange Rate Regimes: Fixed Versus Floating
Define fixed (or pegged) exchange rate regimes (e.g., China and the U.S.) and floating (or flexible) regimes (e.g. the U.S. and the Eurozone).
One might go so far as to say that one of the single most important facts to know about exchange rates is that they are very, very volatile. Plot time series of E's to convince them of this, as in the section below, but with the most recent data.
Having seen Table 2-1, it might be tempting to use the same figures as a guide to today’s exchange rates between countries, but this would be a big mistake. Exchange rates fluctuate. They depreciate and appreciate. A lot. On a single day, in a matter of hours or even minutes, they can change substantially. Over a year, they may move considerably in one direction or another. Any complete theory of exchange rate determination must account for the various exchange rate movements and patterns we see.
Exchange Rate Regimes: Fixed Versus Floating
Economists group different patterns of exchange rate behavior into categories known as exchange rate regimes. These regimes reflect choices made by governments, and the causes and consequences of exchange rate regimes are a major focus of our study.
There are two major regime types:
You might note that "fixed" does not necessarily mean that E doesn't change (since the peg can change frequently), but that it is being set, pegged, by central bank intervention.
- Fixed (or pegged) exchange rate regimes are those in which a country’s exchange rate fluctuates in a narrow range (or not at all) against some base currency over a sustained period, usually a year or longer. A country’s exchange rate can remain rigidly fixed for long periods only if the government intervenes in the foreign exchange market in one or both countries.
- Floating (or flexible) exchange rate regimes are those in which a country’s exchange rate fluctuates in a wider range, and the government makes no attempt to fix it against any base currency. Appreciations and depreciations may occur from year to year, each month, by the day, or every minute.
For example, earlier in the book we saw data for two of the most talked about exchange rates in the world today: the U.S. dollar–euro and the Chinese yuan–U.S. dollar rates. The dollar–euro rate fluctuated considerably and was said to be floating; the yuan–dollar rate held steady or changed very slowly and was said to be fixed.
34
Or adopt this rule of thumb.
However, the “fixed versus floating” classification is not without its problems. First, to determine whether a regime is fixed or floating, we have to decide where we draw the line between “narrow” and “wide” fluctuations. One rule of thumb is to use the size of annual variations (say, within ±2% or ±1%) as the sign of a fixed regime. Second, “fixed versus floating” is only a very broad description of exchange rate regimes. In reality, the distinctions are not so cut and dried. Fixed and floating provide important benchmarks throughout this book and deliver great insights, but we sometimes need more precise ways of describing intermediate regimes, as the following application illustrates.
Digress briefly and talk about how a credible band might in theory dampen exchange rate volatility within the band.
If you can track down the data, a really dramatic case to depict is Mexico in 1982.
Examples of fixed and floating rates as well as examples of regime change:
a. Evidence from Developed Countries: The dollar floats against the yen, pound, and Canadian dollar. The kroner is pegged to the euro.
b. Evidence from Developing Countries: Thailand and Korea suffered exchange rate crises. India used a managed float. Argentina pegged to the dollar, underwent a currency crisis, floated, then pegged within a band. Columbia used a crawl. Ecuador floated, then pegged, then dollarized.
c. Currency Unions and Dollarization
A currency union has a transnational monetary authority (e.g., Eurozone, CFA, and CFP zones). Dollarization is the outright adoption of another country’s currency (e.g., Pitcairn Island and NZ Dollar.
d. Exchange Rate Regimes of the World
Countries classified by degree of exchange rate rigidity: In 2010 51 countries are dollarized or members of currency unions; 7 have currency boards; 35 with other pegs; 43 with bands, crawling pegs, or crawling bands; 46 with wide bands, managed floats, or freely floating rates.
e. Looking Ahead
Two observations: (1) There are two broad classes of regime, fixed and floating. We will study how both work. (2) Most floaters are developed, while most peggers are developing. We will study why some countries float, while others peg.
Recent Exchange Rate Experiences
If we spend a moment looking at recent exchange rate experiences in a variety of countries, we see not only some helpful illustrations of the differences between floating and fixed rate regimes but also some of the different varieties of fixed and floating behavior. We also see examples of regime change, in which one type of regime gives way to another, either smoothly or catastrophically.
Evidence from Developed Countries Figure 13-2 shows the daily exchange rates from 1996 to 2012 for various currency pairs. The top row shows the U.S. dollar exchange rate against two major currencies (the Japanese yen, the British pound sterling) and against the currency of a neighboring country (the Canadian dollar, also called the loonie, because it bears the image of a common loon). The bottom row shows the exchange rate of the euro against the yen, the pound, and the Danish krone. In all six charts, the vertical scale varies by a factor of 2 from maximum to minimum, so all of these charts are comparable in terms of their representation of these exchange rates’ volatility.
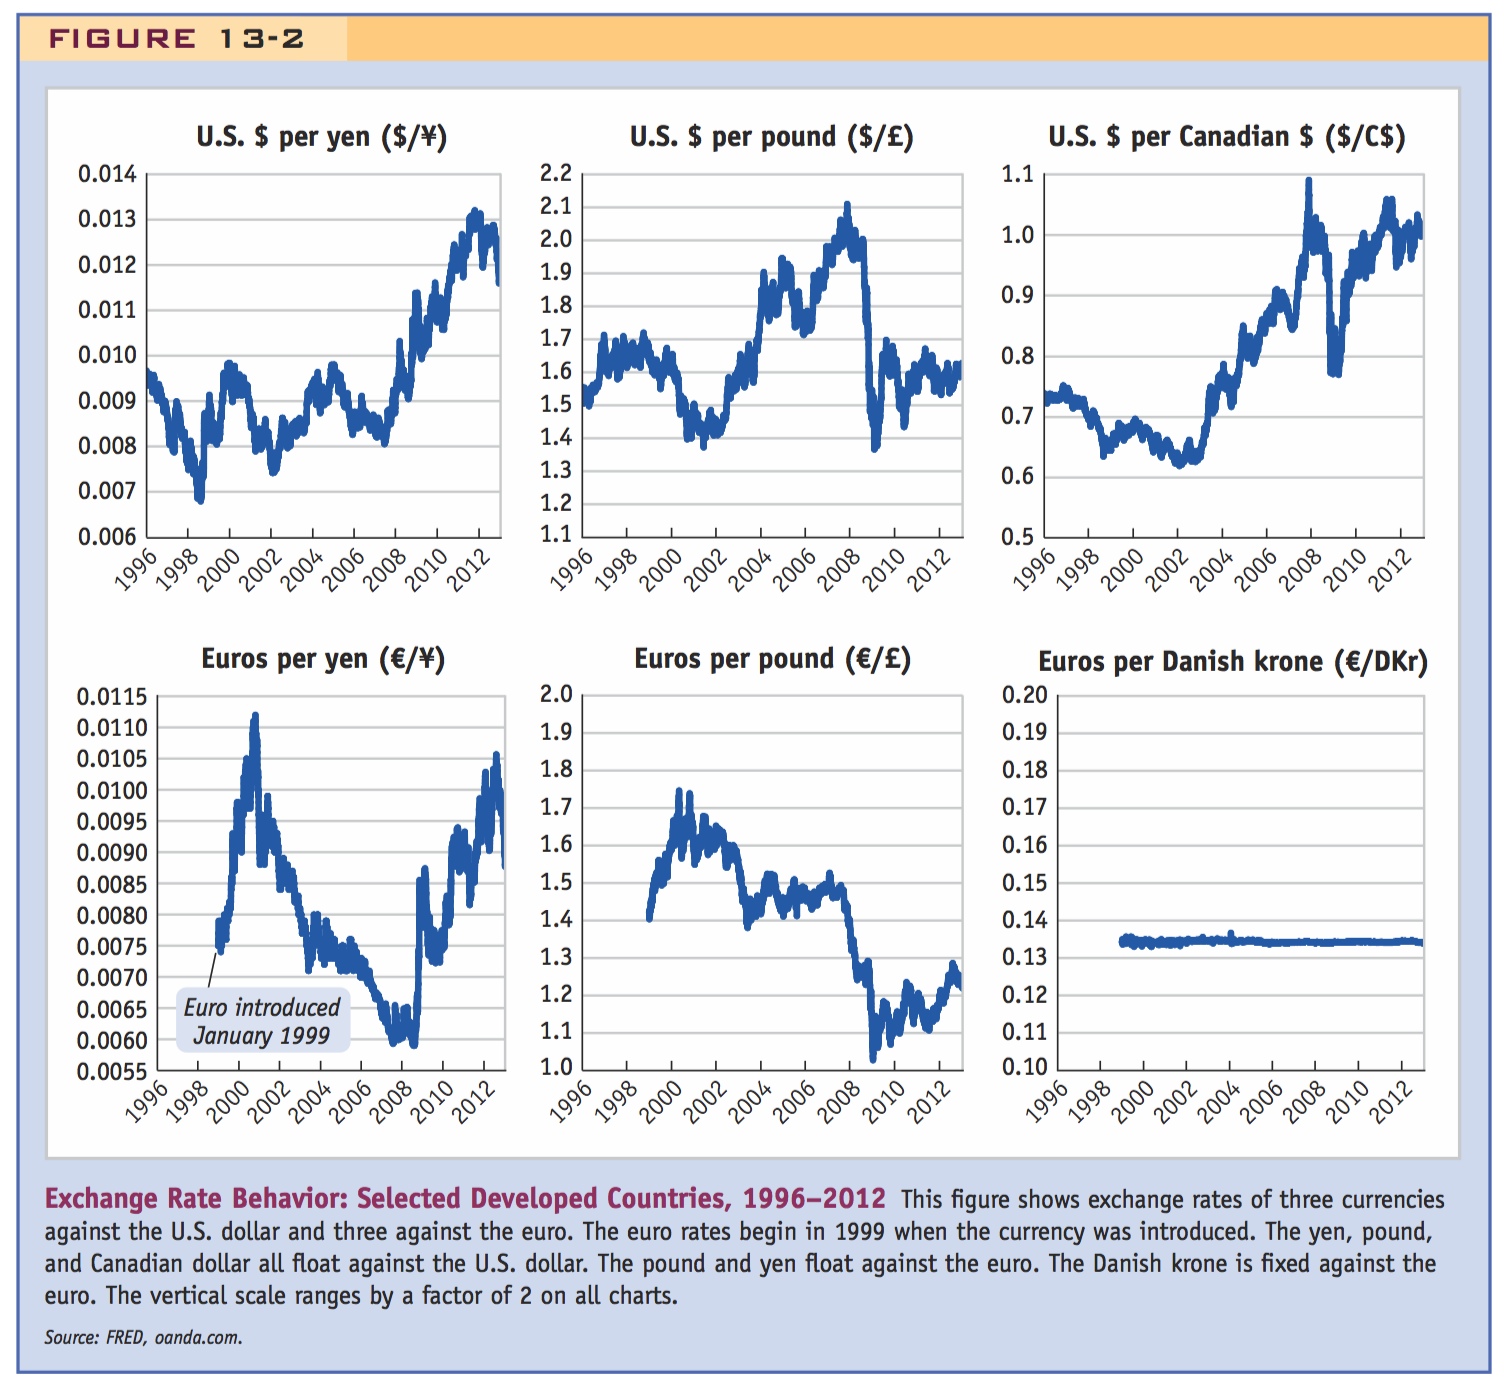
We can clearly see that the U.S. dollar is in a floating relationship with all three foreign currencies shown in the top row—the yen, pound, and loonie. How volatile are the exchange rates? The range of variation in each case is about the same, with the maximum being about one and a half times the minimum: the yen ranges from about $0.007 to $0.013, the pound from $1.3 to almost $2.1, the loonie from $0.6 to about $1.1. The movements between these peaks and troughs may take many months or years to occur, but the exchange rate also shows much short-run volatility, with lots of up-and-down movement from day to day. A floating regime of this sort is called a free float. Similarly, the bottom row of Figure 13-2 shows that the euro floats against the yen and the pound.
In the sixth and final chart, the Danish krone provides a clear contrast—an example of a fixed exchange rate in a developed country. Denmark is part of the European Union, but like Britain, it has kept its own national currency, at least for now, and does not use the euro as its currency. Unlike Britain, however, Denmark has fixed its exchange rate against the euro, keeping it very close to 7.44 krone per euro (0.134 euro per krone). There is only a tiny variation around this rate, well within plus or minus 2%. This type of fixed regime is known as a band.
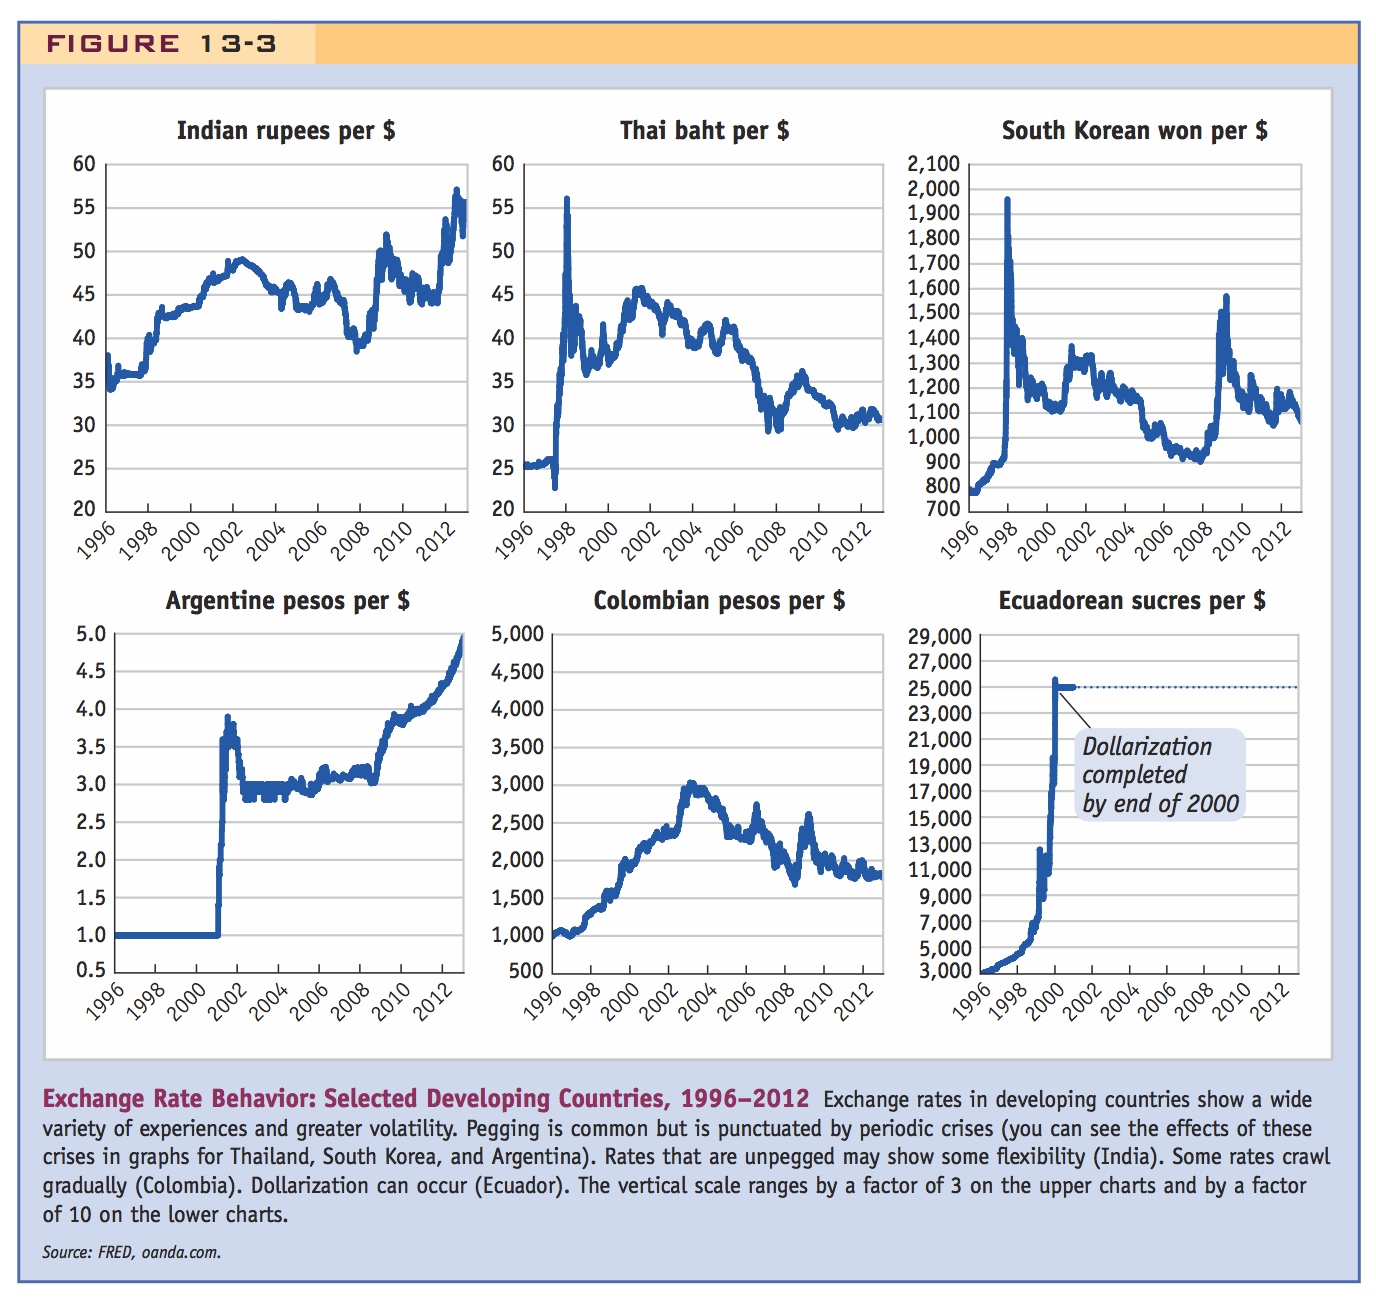
Evidence from Developing Countries Figure 13-3 shows the daily exchange rates against the U.S. dollar from 1996 to 2012 for some developing countries. Exchange rates in developing countries can be much more volatile than those in developed countries. The charts in the top row illustrate exchange rate behavior in three Asian countries (India, Thailand, and South Korea); the maximum on the vertical axis is three times the minimum.
35
India had what looked like a fixed rate of about 35 rupees per dollar until a depreciation in 1997; there was then a period of pronounced movement more like a float. However, the government still acted to prevent abrupt currency movements even after 1997. This middle ground, somewhere between a fixed rate and a free float, is called a managed float (also known as a dirty float, or a policy of limited flexibility).
Thailand and South Korea show more extreme versions of the same pattern, except that in these cases the depreciation in 1997 was large and sudden, with the baht and the won exchange rates more than doubling in a matter of weeks. Such dramatic depreciations are called exchange rate crises and they are more common in developing countries than in developed countries. Indeed, South Korea had another mini-crisis in 2008.
36
The bottom row of Figure 13-3 shows some Latin American countries and more varieties of exchange rate experience. The maximum on the vertical scale is now 10 times the minimum, a change made necessary by the even more volatile exchange rates in this region.
Argentina initially had a fixed rate (of one peso per dollar), followed in 2001 by an exchange rate crisis. After a period of limited flexibility, Argentina returned to an almost fixed rate with a band that appeared to be centered at about 3 pesos per dollar, before drifting higher after 2008.
Colombia presents an example of a different kind of fixed exchange rate. Here the authorities did not target the level of the Colombian peso but allowed it to steadily depreciate at an almost constant rate for several years from 1996 to 2002 (before then switching to a managed float). This type of fixed arrangement is called a crawl (if the exchange rate follows a simple trend, it is a crawling peg; if some variation about the trend is allowed, it is termed a crawling band).
37
In the bottom right corner, Ecuador displays a different crisis pattern. Here a period of floating was followed by a fixed rate rather than the other way around. Episodes of very rapid depreciation like this represent a distinct form of exchange rate behavior; some economists have suggested, not jokingly, that these regimes be identified separately as freely falling exchange rate regimes.5 The Ecuadorean currency stabilized at a fixed rate of 25,000 sucres per dollar, but then the sucre ceased to be. Ecuador took the remarkable step of dollarizing: abolishing its own national currency and adopting the U.S. dollar as its legal tender.
Currency Unions and Dollarization Almost every economy issues its own currency and jealously guards this sovereign right. There are only two exceptions: groups of economies that agree to form a currency or monetary union and adopt a common currency and individual economies that dollarize by adopting the currency of another country as their own.
Under a currency union (or monetary union), there is some form of transnational structure such as a single central bank or monetary authority that is accountable to the member nations. The most prominent example of a currency union is the Eurozone. Other currency unions include the CFA and CFP Franc zones (among some former French colonies in Africa and the Pacific) and the Eastern Caribbean Currency Union of six member states.
Under dollarization one country unilaterally adopts the currency of another country. The reasons for this choice can vary. The adopting country may be very small, so the costs of running its own central bank and issuing its own currency may be prohibitive. Such is the case, for example, for the 60 or so Pitcairn Islanders (who use the New Zealand dollar as their standard currency). Other countries may have a poor record of managing their own monetary affairs and may end up “importing” a better policy from abroad. The currency changeover could be a de jure policy choice; or it may happen de facto if people are so fed up that they stop using the national currency and switch en masse to an alternative. Many of these economies use the U.S. dollar, but other popular choices include the euro, and the Australian and New Zealand dollars.
Exchange Rate Regimes of the World To move beyond specific examples, Figure 13-4 shows a classification of exchange rate regimes around the world, which allows us to see the prevalence of different regime types across the whole spectrum from fixed to floating.6
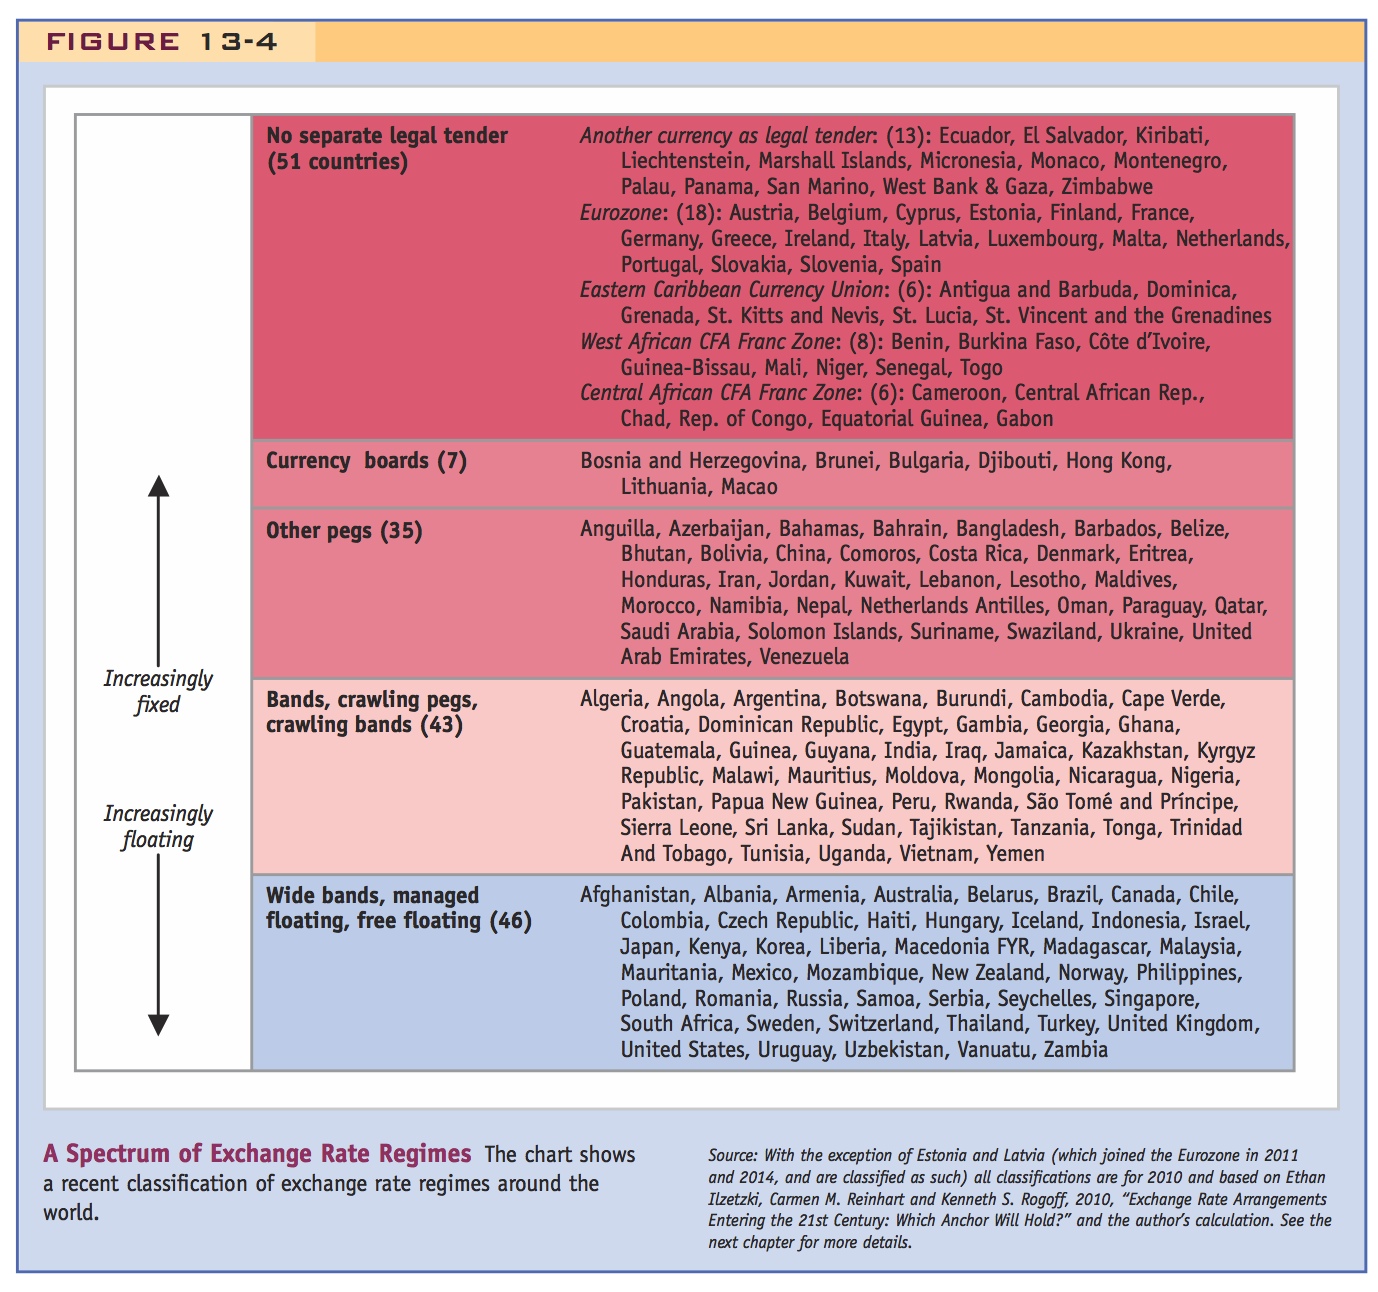
The classification covers 179 economies for the year 2010, and regimes are ordered from the most rigidly fixed to the most freely floating. The first 51 countries are those that have no currency of their own—they are either dollarized or in a currency union. Next are seven countries using an ultrahard peg called a currency board, a type of fixed regime that has special legal and procedural rules designed to make the peg “harder”—that is, more durable. Then come 35 other pegs, with variations of less than ±1%, some fixed to a single currency and a few pegging against a basket of currencies. These are followed by 43 bands, crawling pegs, and crawling bands. We then encounter the more flexible regimes: 46 cases of wide bands, managed floating rates, and freely floating regimes.
38
Looking Ahead This brief look at the evidence motivates the analysis in the remainder of this book. First, the world is divided into fixed and floating rate regimes, so we need to understand how both types of regime work. Studying fixed and floating regimes side by side will occupy much of our attention for the next few chapters. Second, when we look at who is fixed and who is floating, we start to notice patterns. Most of the floaters are advanced countries and most of the fixers are developing countries (the major exception is the euro area). The important question of why some countries fix while others float is covered in more detail in later chapters.
Students will already be asking why countries adopt either. You can only tell stories at this point, and say that we will spend a lot of time addressing that question later.
You may assert that a peg, in general, is a way of stopping inflation. However, without a model to explain this yet, students won't entirely get it.
This is a neat table. Talk through both the categories and the countries in each in class.
Explain that a currency board is designed to eliminate even the possibility of discretionary monetary policy.
39