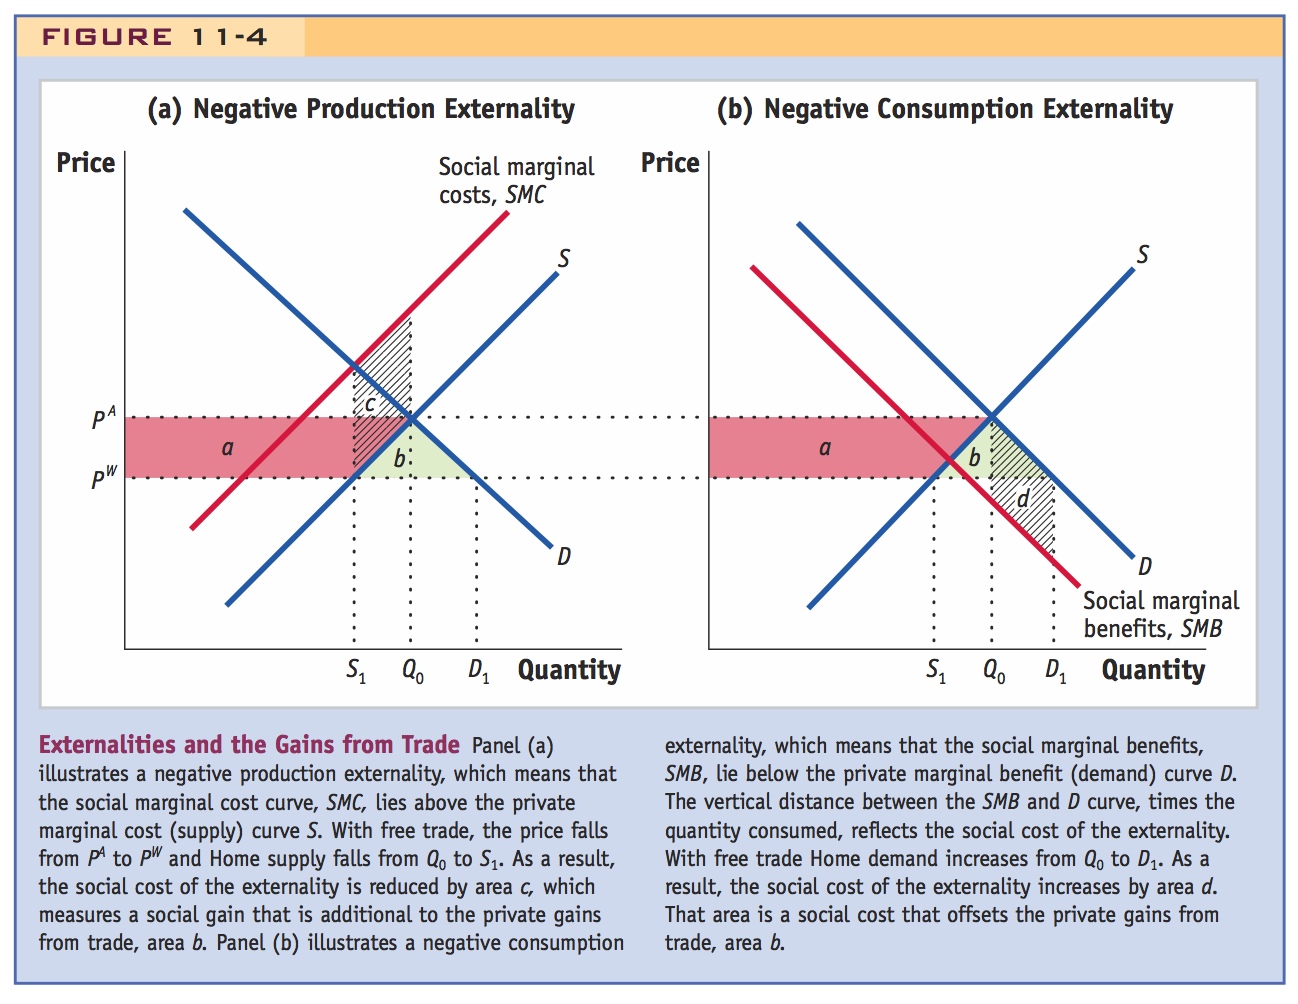
Externalities and the Gains from Trade Panel (a) illustrates a negative production externality, which means that the social marginal cost curve, SMC, lies above the private marginal cost (supply) curve S. With free trade, the price falls from PA to PW and Home supply falls from Q0 to S1. As a result, the social cost of the externality is reduced by area c, which measures a social gain that is additional to the private gains from trade, area b. Panel (b) illustrates a negative consumption externality, which means that the social marginal benefits, SMB, lie below the private marginal benefit (demand) curve D. The vertical distance between the SMB and D curve, times the quantity consumed, reflects the social cost of the externality. With free trade Home demand increases from Q0 to D1. As a result, the social cost of the externality increases by area d. That area is a social cost that offsets the private gains from trade, area b.