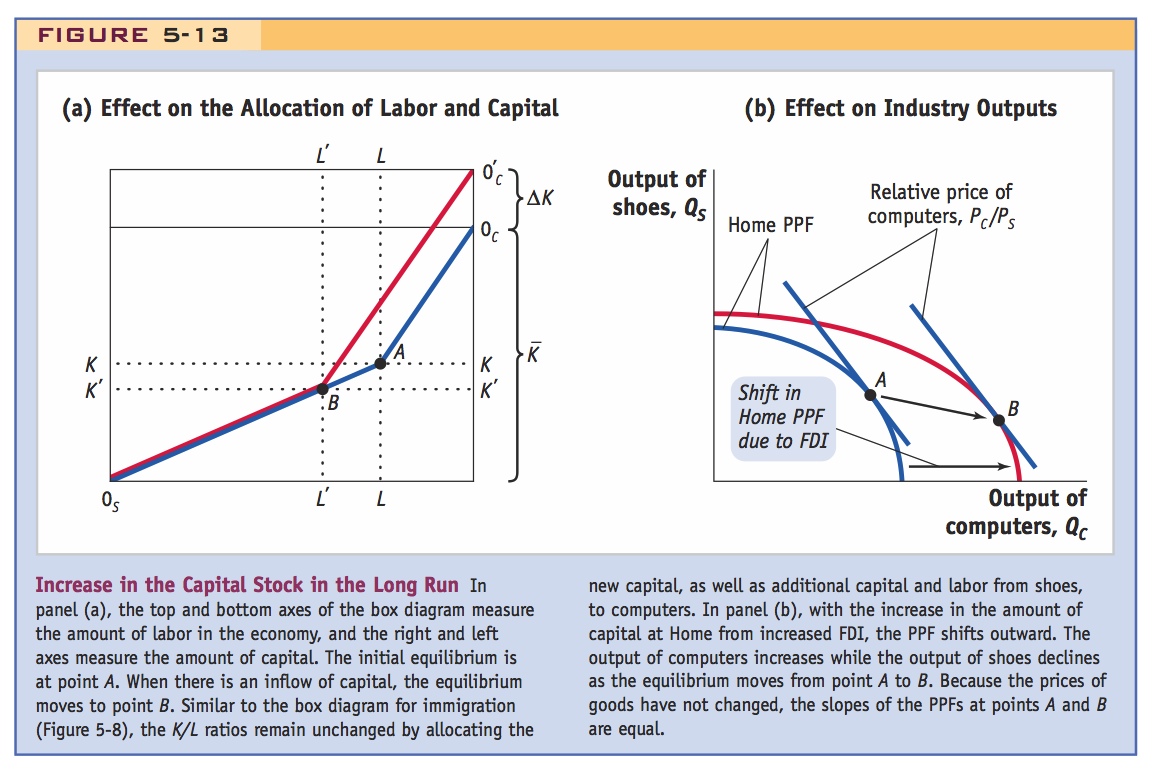
Increase in the Capital Stock in the Long Run In panel (a), the top and bottom axes of the box diagram measure the amount of labor in the economy, and the right and left axes measure the amount of capital. The initial equilibrium is at point A. When there is an inflow of capital, the equilibrium moves to point B. Similar to the box diagram for immigration (Figure 5-8), the K/L ratios remain unchanged by allocating the new capital, as well as additional capital and labor from shoes, to computers. In panel (b), with the increase in the amount of capital at Home from increased FDI, the PPF shifts outward. The output of computers increases while the output of shoes declines as the equilibrium moves from point A to B. Because the prices of goods have not changed, the slopes of the PPFs at points A and B are equal.