3 Gains from Labor and Capital Flows
1. Immigration is controversial because it hurts some people and benefits others. Are there overall benefits from immigration, just as there are overall benefits from trade? Yes.
2. Gains from Immigration
Use specific-factors. Draw a graph with wages on the vertical axis and world labor on the horizontal axis, with the number of workers at Home measured from left to right.
a. Wages at Home and Abroad
The Home wage curve is negatively sloped, since immigration lowers the Home wage. Conversely, the Foreign wage curve is positively sloped. Long run equilibrium occurs at a common wage and full migration.
b. Gains for the Home Country
Motivate the welfare triangle for Home: Foreign workers who migrate to Home when there is less than full migration have VMPLs in excess of the wage.
c. Gains for the Foreign Country
Count the wages of Foreign migrants at Home as part of Foreign income (even if they are not remitted). Mimic the preceding argument to motivate the welfare triangle for Foreign.
d. World Gains from Migration
Approximate measure of the gain from migration. Intuition: These gains are the increase in world GDP permitted by migration. Discuss moving and physical costs of immigration.
Foreign investment and immigration are both controversial policy issues. Most countries impose limits on FDI at some time in their development but later become open to foreign investment. Nearly all countries impose limits on the inflow of people. In the United States, controls on immigration were first established by the Quota Law of 1921, which limited the number of people arriving annually from each country of origin. The Immigration and Nationality Act Amendments of 1965 revised the country-specific limits and allowed immigration on a first-come, first-served basis, up to an annual limit, with special allowances for family members and people in certain occupations. Subsequent revisions to the immigration laws in the United States have established penalties for employers who knowingly hire illegal immigrants, have allowed some illegal immigrants to gain citizenship, or have tightened border controls and deported other illegal immigrants.
Paul Krugman compares the Asian miracle to the rapid growth of the Soviet Union in the 1950s and 1960s.
The Myth of Asia’s Miracle
A CAUTIONARY FABLE: Once upon a time, Western opinion leaders found themselves both impressed and frightened by the extraordinary growth rates achieved by a set of Eastern economies. Although those economies were still substantially poorer and smaller than those of the West, the speed with which they had transformed themselves from peasant societies into industrial powerhouses, their continuing ability to achieve growth rates several times higher than the advanced nations, and their increasing ability to challenge or even surpass American and European technology in certain areas seemed to call into question the dominance not only of Western power but of Western ideology. The leaders of those nations did not share our faith in free markets or unlimited civil liberties. They asserted with increasing self-confidence that their system was superior: societies that accepted strong, even authoritarian governments and were willing to limit individual liberties in the interest of the common good, take charge of their economics, and sacrifice short-run consumer interests for the sake of long-run growth would eventually outperform the increasingly chaotic societies of the West. And a growing minority of Western intellectuals agreed.
The gap between Western and Eastern economic performance eventually became a political issue. The Democrats recaptured the White House under the leadership of a young, energetic new president who pledged to “get the country moving again”—a pledge that, to him and his closest advisers, meant accelerating America’s economic growth to meet the Eastern challenge.
The time, of course, was the early 1960s. The dynamic young president was John F. Kennedy. The technological feats that so alarmed the West were the launch of Sputnik and the early Soviet lead in space. And the rapidly growing Eastern economies were those of the Soviet Union and its satellite nations.
Were you tricked by this fable? Did you think that the “Eastern economies” that the author, Paul Krugman, referred to in the beginning were the Asian economies? Krugman is using this rhetorical trick to suggest that the high growth of the Asian economies is not too different from the growth of the Soviet Union in the 1950s and 1960s, which was due to capital accumulation but without much productivity growth. Other economists disagree and believe that Asian growth is due in significant part to improved productivity, in addition to capital accumulation.
Source: Excerpted from Paul Krugman, 1994, “The Myth of Asia’s Miracle,” Foreign Affairs, November/December, 63–79. Reprinted by permission of FOREIGN AFFAIRS, November/December. Copyright 1994 by the Council on Foreign Relations, Inc. www.ForeignAffairs.com.
152
Why is immigration so controversial? A glance at articles in the newspaper or on the Internet will show that some groups oppose the spending of public funds on immigrants, such as for schooling, medical care, or welfare. Other groups fear the competition for jobs created by the inflow of foreign workers. We have already seen that immigration creates gains and losses for different groups, often lowering the wage for workers in similar jobs but providing benefits to firms hiring these workers.
This finding raises the important question: Does immigration provide an overall gain to the host country, not including the gains to the immigrants themselves? We presume that the immigrants are better off from higher wages in the country to which they move.14 But what about the other workers and owners of capital and land in the host country? In the short run, we learned that workers in the host country face competition from the immigrants and receive lower wages, while owners of capital and land benefit from immigration. When we add up these various gains and losses, are there “overall gains” to the destination country, in the same way as we have found overall gains from trade? Fortunately, this answer turns out to be yes.
Immigration benefits the host country in the specific-factors model, not including the income of the immigrants themselves. If we include the immigrant earnings with Foreign income, then we find that emigration benefits the Foreign country, too. The same argument can be made for FDI. An inflow of capital benefits the host country, not including the extra earnings of foreign capital. By counting those extra earnings in Foreign income, then FDI also benefits the source country of the capital. After showing these theoretical results, we discuss how large the overall gains from immigration or FDI flows might be in practice.
Gains from Immigration
To measure the gains from immigration, we will use the specific-factors model. In Figure 5-14, we measure the world amount of labor on the horizontal axis, which equals  . The number of workers in the Home country
  is measured from left (the origin 0) to right. The number of workers in Foreign
  is measured from right (0*) to left. Each point on the horizontal axis indicates how many workers are located in the two countries. For example, point L indicates that 0L workers are located in Home, and 0*L workers are located in the Foreign country.
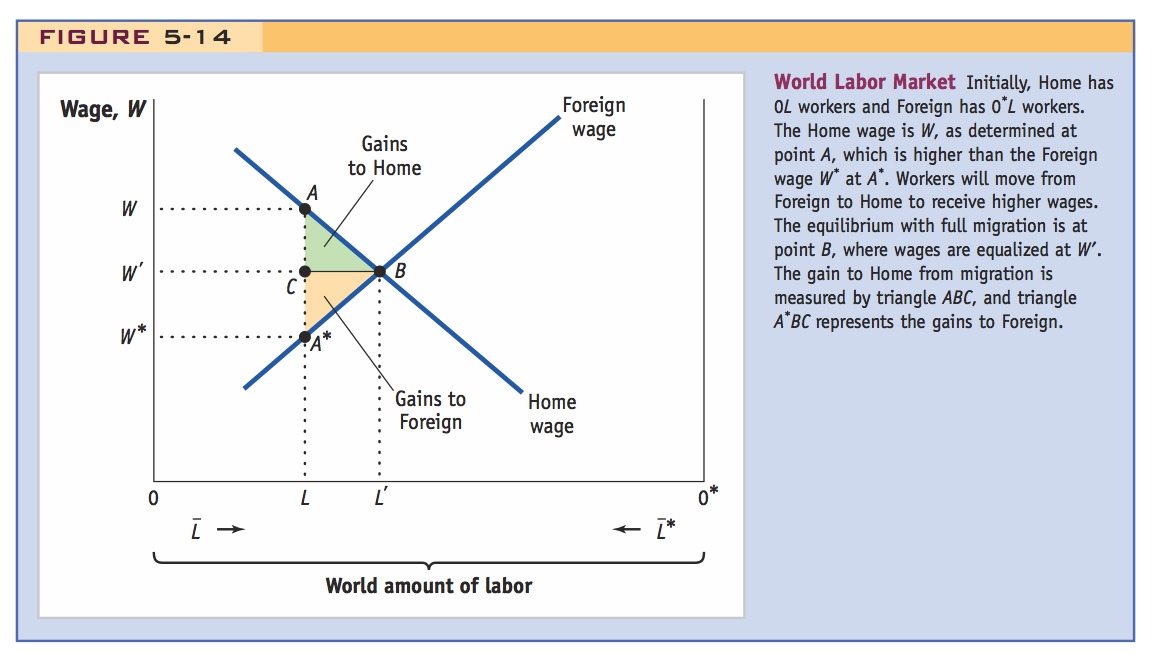
Wages at Home and Abroad We already know from our discussion earlier in the chapter that as immigrants enter the Home country, the wage is reduced. In Figure 5-14, we graph this relationship as a downward-sloping line labeled “Home wage.” With Home workers of 0L before immigration, the wage is W at point A. If Foreign workers enter and the Home labor force grows to 0L′, then the Home wage is reduced to W′ at point B. The downward-sloping “Home wage” line illustrates the inverse relationship between the number of Home workers and their wage. You can think of this line as a labor demand curve, not for a single industry, but for the economy as a whole.
153
Similarly, in the Foreign country, there is an inverse relationship between the numbers of workers and their wage. Before any emigration, the labor force in Foreign is 0*L, and we show the wage at W* at point A*. That is lower than the Home wage of W, so some workers will want to migrate from Foreign to Home. Remembering that we measure the Foreign workers from right (0*) to left, when the labor force abroad shrinks from 0*L to 0*L′, the Foreign wages rise from W* to W′ at point B. We see that as Foreign workers leave, it benefits those left behind by raising their wages.
This same graph could be used to make another point: In a world with free trade and no factor mobility, wages would equalize (factor price equalization) so exactly the same allocation of labor would occur with trade and no factor mobility as without trade but with factor mobility. So trade and factor mobility are in a sense substitutes for one another.
We will refer to point B as the equilibrium with full migration. At this point, the wages earned at Home and abroad are equalized at W′. It would certainly take a long time for migration to lead to complete wage equality across countries. In our discussion of emigration from the Old World to the New, we saw in Figure 5-3 that real wages in the New World were still twice as high as wages in Europe even after 40 years of large-scale migration. So the equilibrium with full migration is reached only in the very long run. The question we want to answer is whether this migration has benefited the workers (not including the immigrants), labor, and capital in the Home country. In addition, we want to know whether migration has benefited the Foreign country, including the migrants.
Gains for the Home Country To determine whether there are overall gains for Home, we need to measure the contribution of each Foreign worker to the output of one good or the other in that country. This measurement is easy to do. The marginal product of labor in either industry (multiplied by the price of shoes or computers) equals the Home wage. So the first Foreign worker to migrate has a marginal product equal to the Home wage, which is W at point A. As more Foreign workers migrate, the marginal product of labor in both Home industries falls due to diminishing returns. We can measure the immigrants’ marginal product by the wage that is paid at Home, which falls from W to W′ as we move down the Home wage curve from point A to B.
154
At the equilibrium with full migration, point B, all Foreign immigrants are paid the Home wage of W′. But all Foreign workers except the last one to enter had a marginal product of labor that is above W′: the first Foreign worker had a marginal product of W, and the later Foreign immigrants have lower marginal products, ranging from W to W′. Therefore, their contribution to the output of goods in the Home economy exceeds the wage that they are paid. The first Foreign immigrant had a marginal product of W but receives the wage W′, so the gain to the Home economy from having that worker is (W − W′). Likewise, each immigrant to come later has a marginal product between W and W′ but is still paid the wage W′, so the difference between their marginal products and wages is a gain for the Home economy.
Adding the gains to the Home economy from the Foreign workers, we end up with the triangle ABC, which represents the Home gains as a result of full immigration. The reason for these gains is the law of diminishing returns: as more Foreign immigrants enter the Home workforce, their marginal products fall, and because the wage equals the marginal product of the last worker, it must be less than the marginal products of the earlier immigrants. This economic logic guarantees gains to the Home country from migration.
Gains for the Foreign Country Now consider the Foreign country. To assess the overall gains from emigration, we include the wages received by the migrants who left in calculating Foreign income. These wages are often returned to their families (see Side Bar: Immigrants and Their Remittances), but even if they are not, we still incorporate the wages earned by the immigrants in our measure of Foreign income because that is from where the migrants originally came.
In the absence of any emigration, the Foreign wage is W*, the marginal product of labor in either industry abroad (multiplied by the price of that product in Foreign). As Foreign workers emigrate, the marginal product of labor remaining in Foreign rises, and the Foreign wage rises from W* to W′ (or from points A* to B in Figure 5-14). Each of these higher marginal products or wages—between W* and W′—equals the drop in Foreign output (of either good) from having workers leave.
Under full migration, all Foreign migrants earn the wage W′ in the Home country. Notice that this wage is higher than their Foreign marginal products of labor, which are between W* and W′. The difference between the wage earned by the migrants and their Foreign marginal products equals the gain to Foreign. Adding up the gains over all Foreign emigrants, we obtain the triangle A*BC. This gain represents the earnings of the emigrants over and above the drop in output that occurs when they leave Foreign.
Draw the lesson that migration increases the size of the world's pie, just like trade does. This follows from the preceding comment.
World Gains from Migration Combining the gains to the Home and Foreign countries, we obtain the triangular region ABA*, the world gains from immigration. This magnitude is not too difficult to measure in practice. Turning the triangle on its side, its base equals (W − W*), the difference in the Home and Foreign wage in the absence of any migration. The height of the triangle is (L′ − L), the number of foreign workers that would emigrate in the equilibrium with full migration. So the area of the triangle is 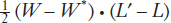 . To solve for the area, we need to know the difference in wages before any migration and the number of people who would emigrate.
155
Data on remittances by immigrants from different countries. Are they sufficient to compensate home countries for the loss of their labor? Bhagwati’s idea of a “brain-drain tax.”
Immigrants and Their Remittances
Immigrants often send a substantial portion of their earnings back home, which we refer to as “remittances.” According to estimates from the World Bank, remittances to developing countries were $406 billion in 2012, up from $372 billion in 2011. In 2011, official aid to foreign governments was $156 billion, less than half the amount of remittances from immigrants back to their home countries. The countries receiving the largest amount of remittances in 2011 were India ($64 billion), China ($62 billion), Mexico ($24 billion), and the Philippines ($23 billion). As a share of GDP, however, remittances are highest in smaller and lower-income countries, including Tajikistan (31%), Lesotho (29%), Samoa (23%), Kyrgyz Republic (21%), and Nepal and Tonga (20% each). In 2011, there were about 215 million immigrant workers in the world, so the remittances of $372 billion translate into each immigrant worker sending home approximately $1,800.
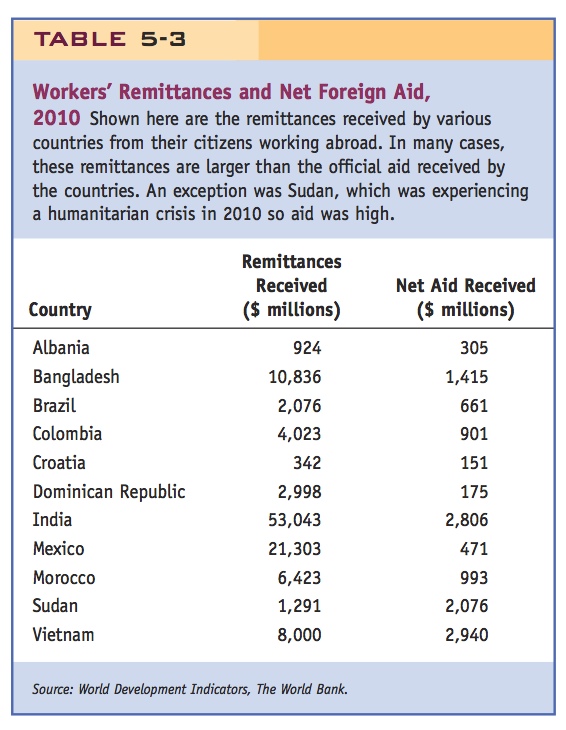
In Table 5-3, we show the remittances received by some developing countries in 2010, as compared with their net foreign aid. For all countries except Sudan, the income sent home by emigrants is a larger source of income than official aid. Sudan was experiencing a humanitarian crisis in 2010 so official aid was high. Remittances and official aid are especially important in other African countries, too.
The fact that emigrants return some of their income back home may not be enough to compensate their home countries for the loss of their labor. To calculate any gain to the home countries from the emigration of their workers, we need to include all the earnings of the emigrants in their home countries’ income. In reality, however, emigrants do not send all of their income home, so the countries they leave can lose from their outflow. Consider, for example, the case of highly educated migrants. In 2000 there were 1 million Indian-born people with college educations living in the 30 wealthy countries of the Organisation for Economic Co-operation and Development (OECD). That amounts to 4.3% of India’s large number of college graduates. In 2008, 53% of Indian-born migrants living in the OECD had a postsecondary education. For Asia as a whole, 38% of migrants living in the OECD had a postsecondary education. But for some individual countries, the outflow is much larger. Almost 47% of Ghana’s college-educated labor force lives in OECD countries, and for Guyana, the percentage is 89%.15 Unless these migrants return most of their earnings back home, those countries lose from the outflow of these highly educated workers.
To address this concern, Jagdish Bhagwati, an Indian-born economist now at Columbia University in New York, has proposed that countries impose a “brain-drain tax” on the outflow of educated workers. The idea is to tax the earnings of people living outside the countries in which they were born and, through an organization such as the United Nations, return the proceeds from the tax to the countries that lose the most workers. In that way, countries with an outflow of educated workers would be compensated, at least in part, for the outflow. A brain-drain tax has been widely debated, but so far it has not been used in practice.
This may elicit chuckles in class.
156
One way to think about the world gains from migration is that they equal the increase in world GDP due to immigration. To understand why this is so, think about the first person to migrate from Foreign to Home. That person earns the wage W* in Foreign, which equals his or her marginal product times the price in the industry in which he or she works. When this individual leaves Foreign, GDP in that country falls by W*. Once he or she moves to Home, he or she earns W, which again reflects the marginal product times the industry price. So W equals the increase in Home GDP when the immigrant begins working. The difference between the Home and Foreign wages therefore equals the net increase in world GDP due to migration. By adding up this amount across all migrants, we obtain the triangular region ABA*, the increase in world GDP and the world gains due to migration.
In practice, however, there are other costs that immigrants bear that would make the gains from immigration less than the increase in world GDP. Immigrants often face sizable moving costs, including the psychological costs of missing their families and home countries as well as monetary payments to traffickers of illegal immigrants. These costs should be subtracted from the increase in GDP to obtain the net gains. Because all the moving costs are hard to quantify, however, in the next application we measure the net gains from immigration by the increase in Home or world GDP.
This mirrors the low estimated benefits of free trade too, as might be expected from the preceding comments.
Various estimates of the gain from migration, surprisingly low.
e. Gains from Foreign Direct Investment
Symmetrical argument to gains from migration.
Gains from Migration
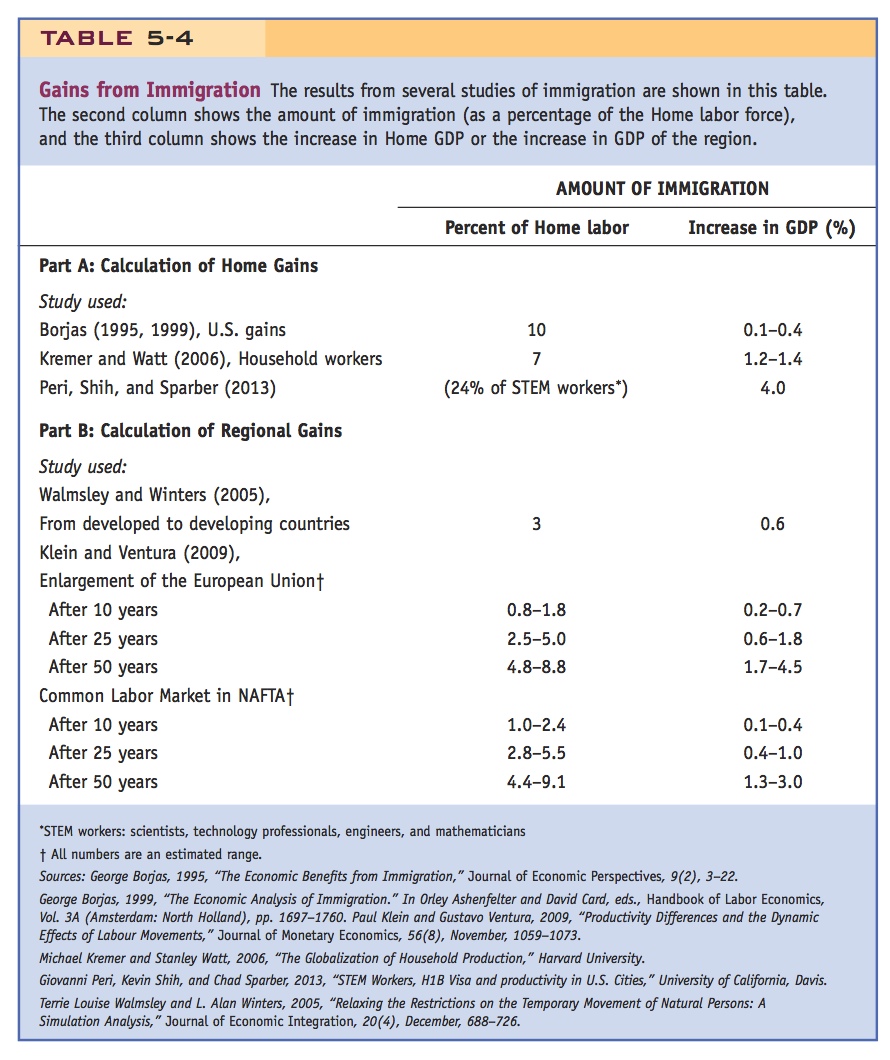
How large are the gains from immigration? For the United States, a study by the economist George Borjas puts the net gain from immigration at about 0.1% of GDP (one-tenth of 1% of GDP). That value is obtained by using a stock of immigrants equal to 10% of the workforce in the United States and assuming that the immigrants compete for the same jobs as U.S. workers. If instead we assume the immigrants are lower-skilled on average than the U.S. population, then the low-skilled immigrants can complement the higher-skilled U.S. population, and the gains from immigration in the United States are somewhat higher, up to 0.4% of GDP. These estimates are shown in the first row of Table 5-4. The net gains to the United States in this case equal the increase in U.S. GDP.
Borjas’s estimates for the U.S. gains from immigration may seem small, but lying behind these numbers is a larger shift in income from labor to capital and landowners. Labor loses from immigration, while capital and landowners gain, and the net effect of all these changes in real income is the gain in GDP that Borjas estimates. For the net gain of 0.1% of U.S. GDP due to immigration, Borjas estimates that capital would gain 2% and domestic labor would lose 1.9% of GDP. These figures lead him to conclude, “The relatively small size of the immigration surplus [that is, the gain in GDP]—particularly when compared to the very large wealth transfers caused by immigration [that is, the shift in income from labor to capital]—probably explains why the debate over immigration policy has usually focused on the potentially harmful labor market impacts rather than the overall increase in native income.”
157
Other calculations suggest that the overall gains from immigration could be larger than Borjas’s estimates. In the second row of Table 5-4, we report figures from a study by Kremer and Watt that focuses on just one type of immigrant: household workers. Foreign household workers, who are primarily female, make up 10% or more of the labor force in Bahrain, Kuwait, and Saudi Arabia, and about 7% of the labor force in Hong Kong and Singapore. The presence of these household workers often allows another member of that household—typically, a highly educated woman—to seek employment in her Home country. Thus, the immigration of low-skilled household workers allows for an increase in the high-skilled supply of individuals at Home, generating higher Home GDP as a result. It is estimated that this type of immigration, if it accounts for 7% of the workforce as in some countries, would increase Home GDP by approximately 1.2% to 1.4%.
158
Another larger estimate of the gains from immigration was obtained in a study by Giovanni Peri, who wrote Headlines: The Economic Windfall of Immigration Reform, seen earlier in the chapter. Peri and his co-authors measured the inflow of foreign workers to the United States who are scientists, technology professionals, engineers, or mathematicians—or STEM workers, for short. The H-1B visa program has allowed between 50,000 and 150,000 of these immigrants to enter the United States annually since 1991. Many have remained in the country as permanent residents. By 2010, foreign-born STEM workers accounted for 1.1% of the population in major cities in the United States, and accounted for 24% of the total STEM workers (foreign or U.S.-born) found in these cities. Peri and his co-authors measured the productivity gains to these cities from having this inflow of foreign talent, and they found that the gains were substantial: as mentioned in the earlier Headlines article, they found that 10% to 20% of the productivity growth in these cities can be explained by the presence of the foreign STEM workers. These productivity gains can come from new start-up technology companies, patents for new inventions, and so on. Adding up these productivity gains over time, the presence of the foreign STEM workers accounted for a 4% increase in GDP in the United States by 2010.
In part B of Table 5-4, we report results from estimates of gains due to migration for several regions of the world. The first study, by Walmsley and Winters, found that an increase in labor supply to developed countries of 3%, as a result of immigration from the developing countries, would create world gains of 0.6% of world GDP. This calculation is similar to the triangle of gains ABA* shown in Figure 5-14. The next study, by Klein and Ventura, obtains larger estimates of the world gains by modeling the differences in technology across countries. Under this approach, wealthier regions have higher productivity, so an immigrant moving there will be more productive than at home. This productivity increase is offset somewhat by a skill loss for the immigrant (since the immigrant may not find the job for which he or she is best suited, at least initially). Nevertheless, the assumed skill loss is less than the productivity difference between countries, so immigrants are always more productive in the country to which they move.
In their study, Klein and Ventura considered the recent enlargement of the European Union (EU) from 15 countries to 25.16 Workers from the newly added Eastern European countries are, in principle, permitted to work anywhere in the EU. Klein and Ventura assumed that the original 15 EU countries are twice as productive as the newly added countries. During the first 10 years, they found that the population of those 15 EU countries increased by an estimated 0.8% to 1.8%, and the combined GDP in the EU increased by 0.2% to 0.7%. The range of these estimates comes from different assumptions about the skill losses of immigrants when they move, and from the psychological costs of their moving, which slow down the extent of migration. As time passed, however, more people flowed from Eastern to Western Europe, and GDP continued to rise. Klein and Ventura estimated that in 25 years the combined GDP of the EU will increase by 0.6% to 1.8%, and that over 50 years, the increase in GDP would be 1.7% to 4.5%.
159
Next, Klein and Ventura considered a common labor market within the North American Free Trade Area (NAFTA), established in 1994, which consists of Canada, Mexico, and the United States. Although NAFTA allows for free international trade between these countries, labor mobility is not free. So the experiment that Klein and Ventura considered allowed workers from Mexico to migrate freely to the United States and Canada, which are assumed to have workers who are 1.7 times as productive as those from Mexico. During the first 10 years, they predicted that the population of the United States and Canada would increase by an estimated 1.0% to 2.4% due to the immigration from Mexico, and the combined GDP in the NAFTA region would increase by 0.1% to 0.4%. After 25 years, they estimated that the combined GDP of the region would increase by 0.4% to 1.0%, and over 50 years, the increase in GDP would be 1.3% to 3.0%. These estimates are hypothetical because they assume free mobility of labor within the NAFTA countries, which did not occur. In the next chapter we will discuss some other estimates of the gains due to NAFTA, based on the actual experience of the countries involved with free international trade, but without free labor mobility.
But presumably Mexico would benefit relatively more, just because the Mexican economy is so much smaller.
Gains from Foreign Direct Investment
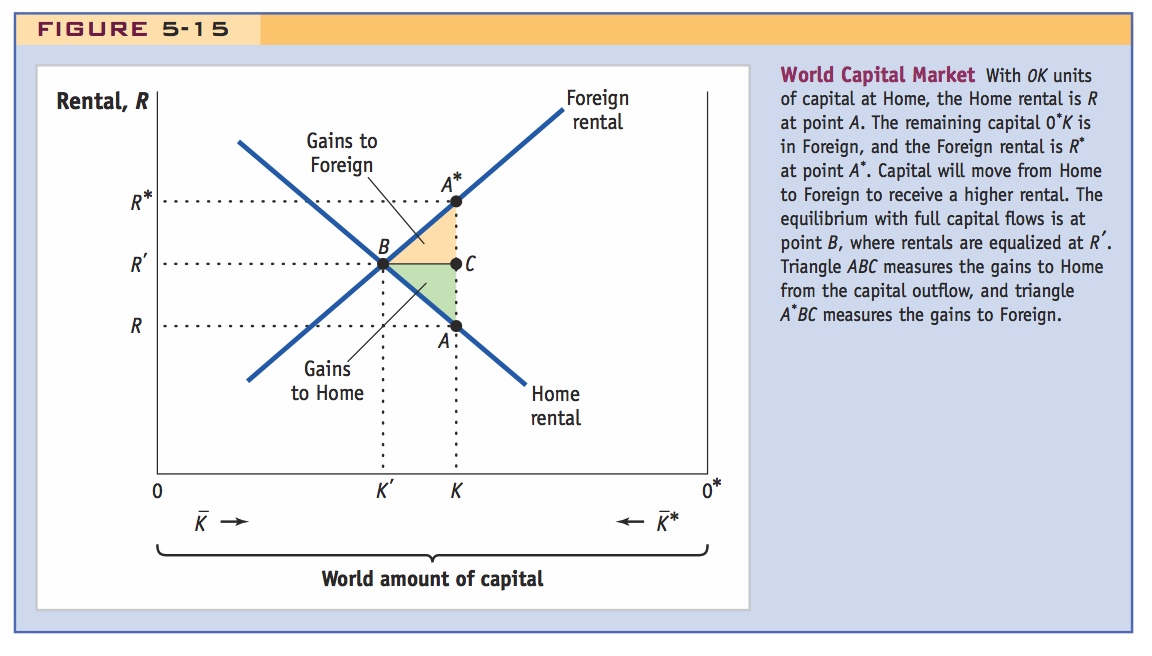
A diagram very similar to Figure 5-14 can be used to measure the gains from FDI. In Figure 5-15, we show the world amount of capital on the horizontal axis, which equals  . The rental earned in each country is on the vertical axis. With 0K units of capital employed at Home (measured from left to right), the Home rental is R, determined at point A. The remaining capital 0*K (measured from right to left) is in Foreign, and the Foreign rental is R*, determined at point A*.
160
Because the Foreign rental is higher than that at Home, capital will flow from Home to Foreign. As it enters Foreign, the additional capital will reduce the marginal product of capital and bid down the rental. Likewise, as capital leaves Home, the marginal product of capital will increase, and the Home rental will be bid up. The equilibrium with full capital flows is at point B, where rentals are equalized at R′. Similar to what we found in the case of immigration, the gains to Home from the capital outflow is the triangle ABC, while the gains to Foreign is the triangle A*BC, and the world gains are A*BA.