Chapter 3. Responses of Simple Cells in V1
3.1 Title slide

Responses of Simple Cells in V1
Simulate an experiment to find the location and structure of the receptive field of a simple cell in V1.
CLICK ANYWHERE TO BEGIN
What Determines the Responses of Simple Cells in V1?
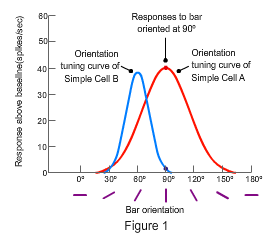
The preferred orientation of the cell—that is, the orientation that tends to produce the strongest response—is determined by flashing bars with various orientations in the receptive field and measuring the response (spikes) evoked by each orientation. Such experiments produce results like those shown in Figure 1, where the orientation tuning curves represent the responses of two different simple cells (A and B) to bars with a full range of orientations.

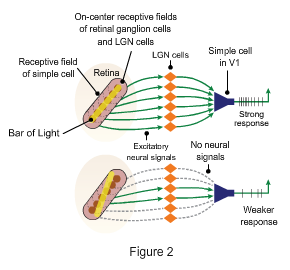
What are the connections—from RGCs to cells in the lateral geniculate nucleus (LGN) to simple cells in V1—that make these response patterns possible? Multiple RGCs with aligned receptive fields connect one-to-one with multiple LGN cells that all connect to the same simple cell. Each LGN neuron has a circular, center–surround receptive field corresponding to the receptive field of the RGC to which it connects. The simple cell's receptive field is an elongated shape with an excitatory central area and inhibitory surrounding area, corresponding to the way in which the excitatory centers and inhibitory surrounds of the receptive fields of the RGCs and the LGN cells overlap.
As shown in Figure 2 (top) the simple cell responds strongly when the excitatory centers of the LGN cells' receptive fields are covered by a bar of light oriented at the same angle as the aligned receptive fields. Figure 2 (bottom) shows that if the bar is oriented at a different angle, it covers less of the excitatory centers and more of the inhibitory surrounds, resulting in a weaker response from the simple cell.

3.2 Explain - dnd
This area of the retina contains the receptive fields of Simple Cells A and B in the primary visual cortex (area V1). Each simple cell has a preferred orientation:
it responds most strongly to a stimulus that covers the entire excitatory center of its receptive field without covering any of the inhibitory surround.
Drag different stimuli across the retina and watch the cells' responses. Can you determine the preferred orientation of each cell and the location of its
receptive field? Click SHOW RECEPTIVE FIELD to check your conclusions.
3.3 Explain
What Determines the Responses of Simple Cells in V1?
The preferred orientation of the cell—that is, the orientation that tends to produce the strongest response—is determined by flashing bars with various orientations in the receptive field and measuring the response (spikes) evoked by each orientation. Such experiments produce results like those shown in Figure 1, where the orientation tuning curves represent the responses of two different simple cells (A and B) to bars with a full range of orientations.
What are the connections—from RGCs to cells in the lateral geniculate nucleus (LGN) to simple cells in V1—that make these response patterns possible? Multiple RGCs with aligned receptive fields connect one-to-one with multiple LGN cells that all connect to the same simple cell. Each LGN neuron has a circular, center–surround receptive field corresponding to the receptive field of the RGC to which it connects. The simple cell's receptive field is an elongated shape with an excitatory central area and inhibitory surrounding area, corresponding to the way in which the excitatory centers and inhibitory surrounds of the receptive fields of the RGCs and the LGN cells overlap.
As shown in Figure 2 (top) the simple cell responds strongly when the excitatory centers of the LGN cells' receptive fields are covered by a bar of light oriented at the same angle as the aligned receptive fields. Figure 2 (bottom) shows that if the bar is oriented at a different angle, it covers less of the excitatory centers and more of the inhibitory surrounds, resulting in a weaker response from the simple cell.

3.4 Test - single choice
Select your answer to the question below. Then click SUBMIT.
Which statement correctly describes how simple cells in V1 respond to stimuli?
3.5 Test - single choice
Select your answer to the question below. Then click SUBMIT.
Suppose a simple cell in V1 with a preferred orientation of 65° responds above baseline to a bar of light oriented at 90° at a particular location on the retina. What will tend to happen if a bar with an orientation of 75° stimulates the same location?
3.6 Test - single choice
Select your answer to the question below. Then click SUBMIT.

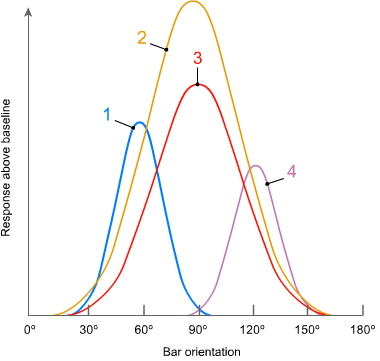
The graph shows the orientation tuning curves of four simple cells in V1. Which do you think will tend to respond most strongly to a bar of light oriented at 45° and centered on its receptive field? Which cell will tend to respond least?
3.7 Test - single choice
Select your answer to the question below. Then click SUBMIT.
We recognize objects largely by their shape, and the shape of an object is defined by the position and orientation of its edges. All of the following statements are true—which indicates that simple cells in V1 are involved in object identification?
3.8 Activity completed
Responses of Simple Cells in V1.