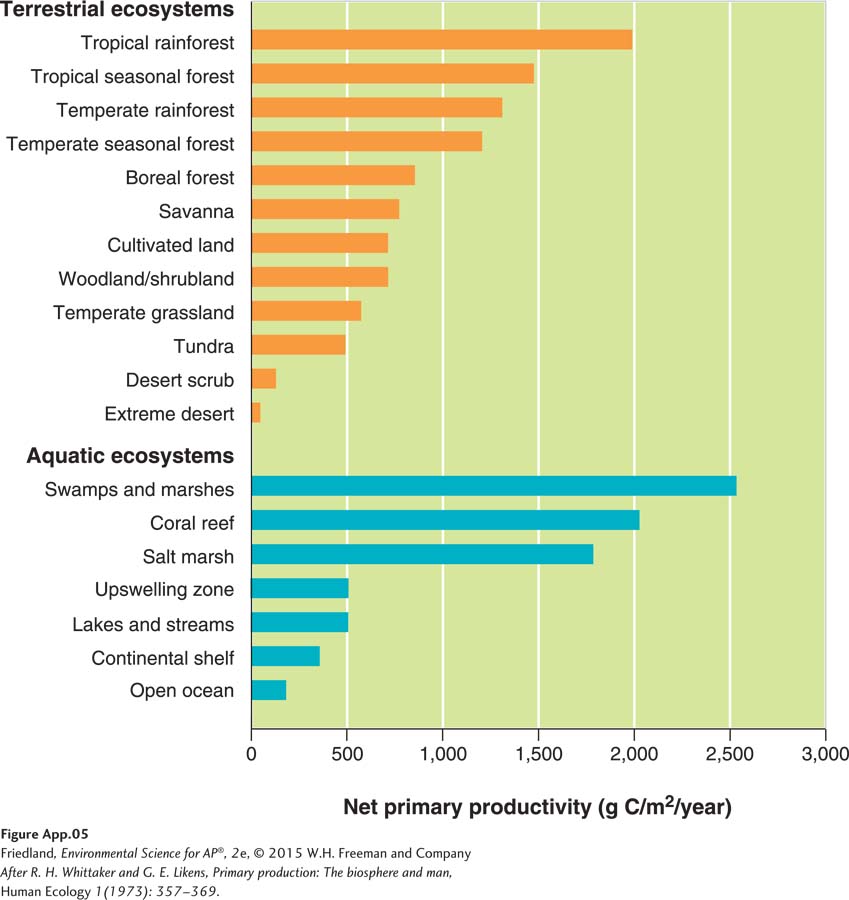
FIGURE A.5 (book FIGURE 6.8) A rotated bar graph. Bar graphs can place the categories on either the x axis, as in FIGURE A.4, or on the y axis, as in this figure that plots the net primary productivity of different ecosystems.
(After R. H. Whittaker and G. E. Likens, Primary production: The biosphere and man, Human Ecology 1 (1973): 357–