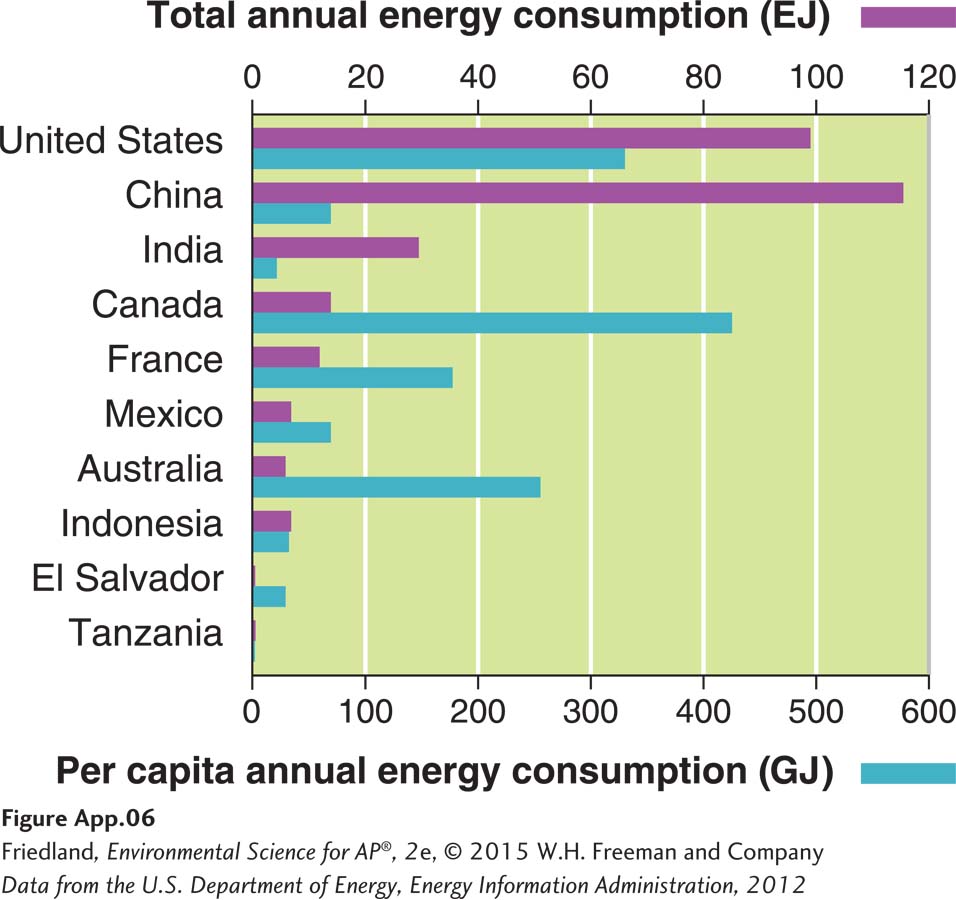
FIGURE A.6 (book FIGURE 34.2) A rotated bar graph with two sets of data. In this bar graph, we have nations as our categories and two sets of numerical data: the total energy consumed by each country and the per capita annual energy consumed.
(Data from the U.S. Department of Energy, Energy Information Administration, 2012)