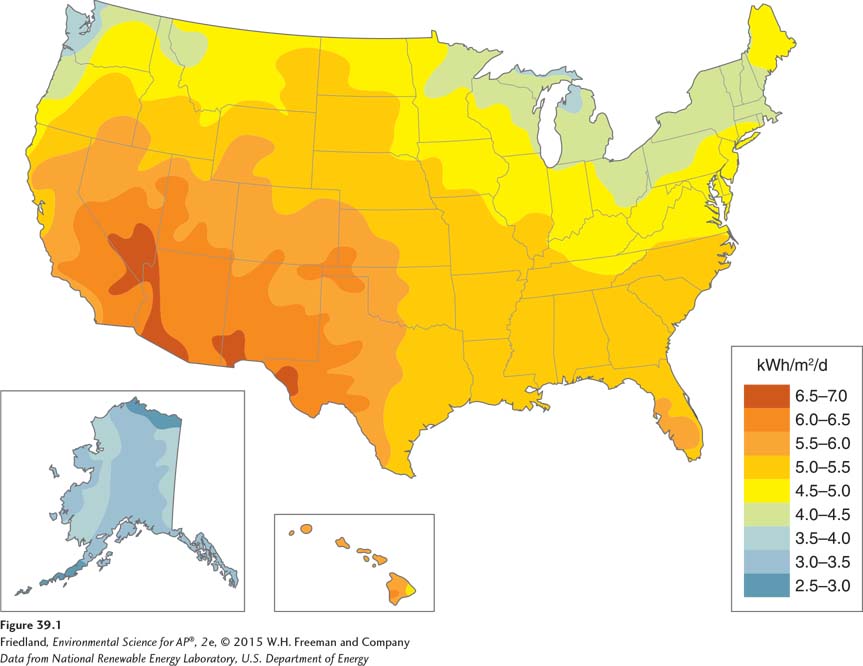
FIGURE 39.1 Geographic variation in solar radiation in the United States. This map shows the amount of solar energy available to a flat photovoltaic solar panel in kilowatt-
(Data from National Renewable Energy Laboratory, U.S. Department of Energy)