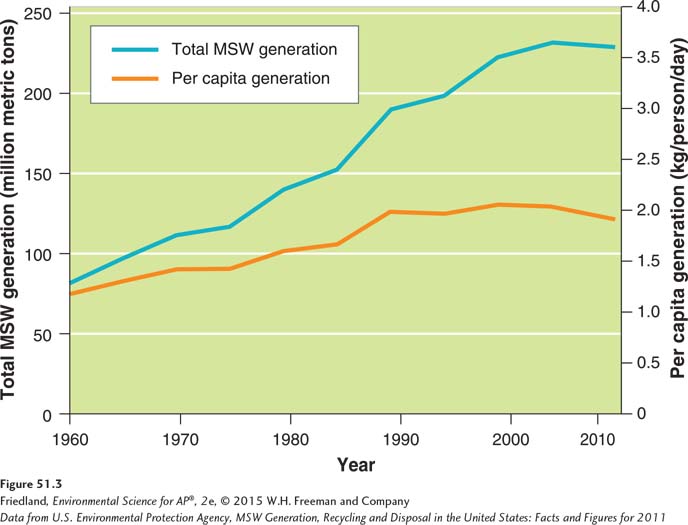
FIGURE 51.3 Municipal solid waste generation in the United States, 1960–
(Data from U.S. Environmental Protection Agency, MSW Generation, Recycling and Disposal in the United States: Facts and FIGUREs for 2011)