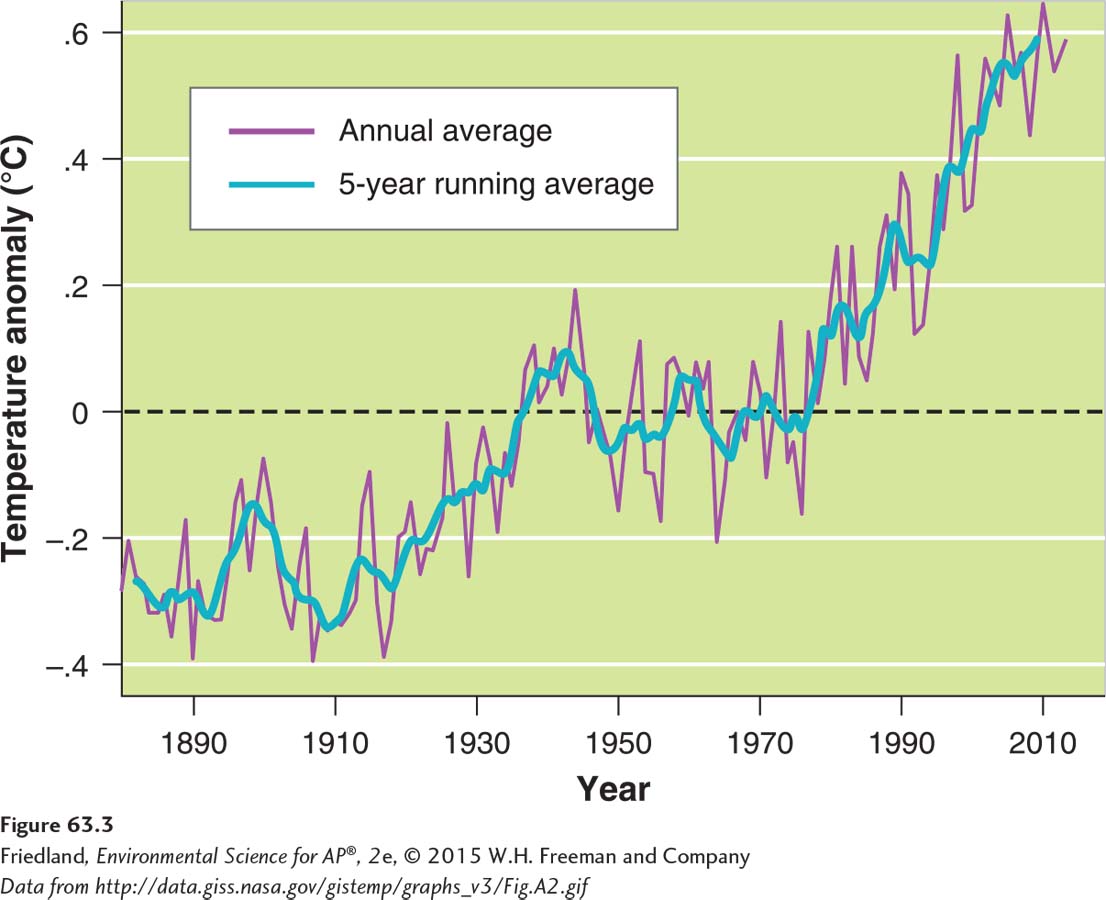
FIGURE 63.3 Changes in mean global temperatures over time. Although annual mean temperatures can vary from year to year, temperatures have exhibited a slow increase from 1880 to 2012. This pattern becomes much clearer when scientists compute the average temperature each year for the past 5 years.
(Data from http://data.giss.nasa.gov/gistemp/graphs_v3/Fig.A2.gif)