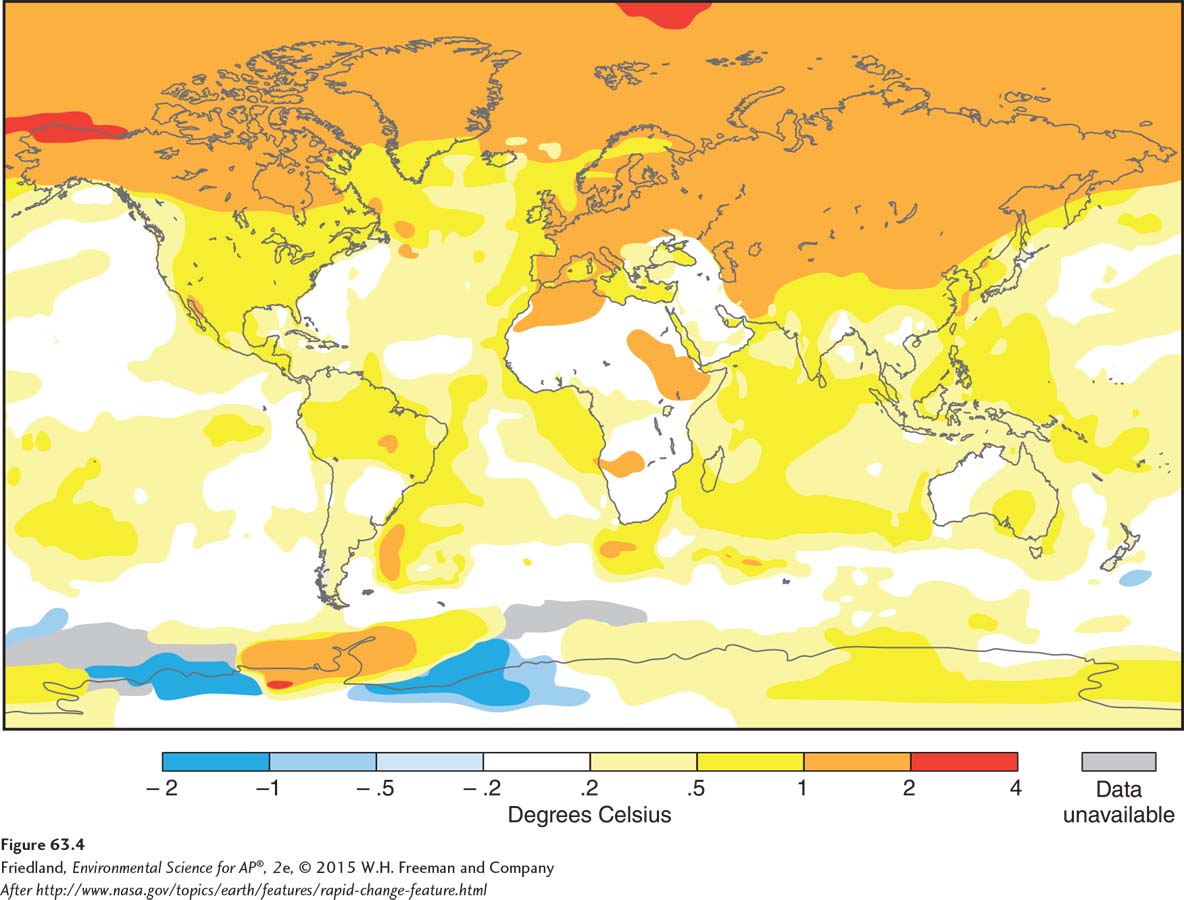
FIGURE 63.4 Changes in mean annual temperature in different regions of the world. In 2010, some regions became cooler, some regions had no temperature change, and the northern latitudes became substantially warmer than the long-
(After http://www.nasa.gov/topics/earth/features/rapid- e-