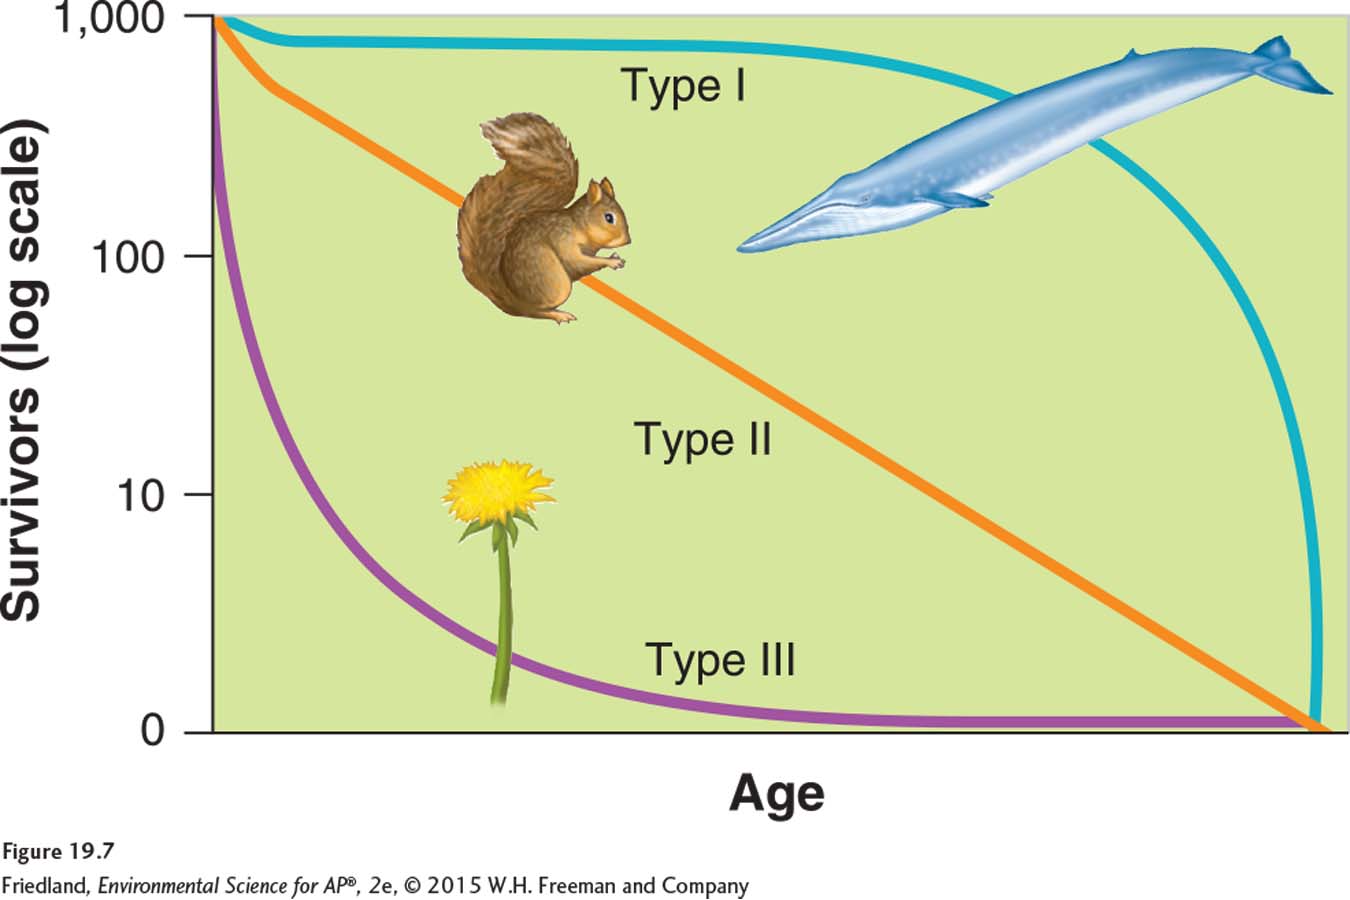
FIGURE 19.7 Survivorship curves. Different species have distinct patterns of survivorship over the life span. Species range from exhibiting excellent survivorship until old age (type I curve) to exhibiting a relatively constant decline in survivorship over time (type II curve) to having very low rates of survivorship early in life (type III curve). K-selected species tend to exhibit type I curves, whereas r-selected species tend to exhibit type III curves.