image
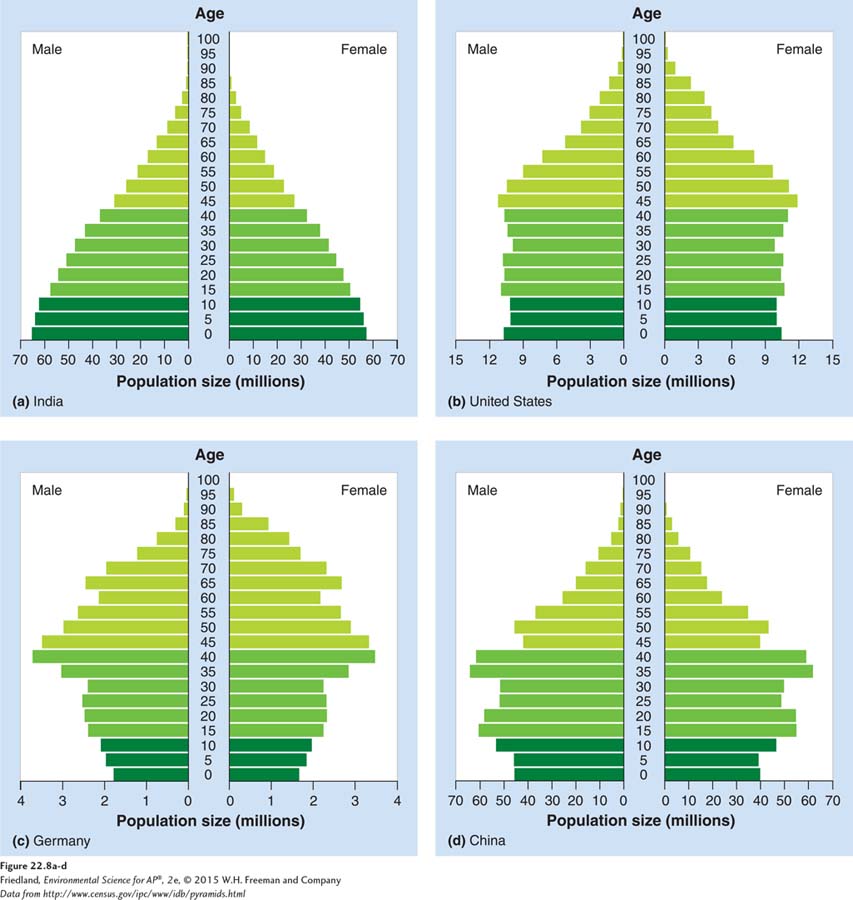
FIGURE 22.8 Age structure diagrams in 2010. The horizontal axis of the age structure diagram shows the population size in millions for males and females in each 5-year age group shown on the vertical axis. (a) A population pyramid illustrates a rapidly growing population. (b) A column-shaped age structure diagram indicates population stability. (c) In some developed countries, the population is declining. (d) China’s population control measures will eventually lead to a population decline.
(Data from http://www.census.gov/ipc/www/idb/pyramids.html)