module 34 Patterns of Energy Use
399
In this module we begin our study of nonrenewable energy sources by looking at patterns of energy use throughout the world and in the United States. We will see how evaluating energy efficiency can help us determine the best application for different energy sources. Finally, because electricity accounts for such a large percentage of our overall energy use, we will examine the ways in which electricity is generated.
Learning Objectives
After reading this module, you should be able to
describe the use of nonrenewable energy in the world and in the United States.
explain why different forms of energy are best suited for certain purposes.
understand the primary ways that electricity is generated in the United States.
Nonrenewable energy is used worldwide and in the United States
Fossil fuel A fuel derived from biological material that became fossilized millions of years ago.
Nonrenewable energy resource An energy source with a finite supply, primarily the fossil fuels and nuclear fuels.
Nuclear fuel Fuel derived from radioactive materials that give off energy.
Fossil fuels are fuels derived from biological material that became fossilized millions of years ago. Fuels from this source provide most of the energy used in both developed and developing countries. The vast majority of the fossil fuels we use—
Every country in the world uses energy at different rates and relies on different energy resources. Factors that determine the rate at which energy is used include the resources that are available and affordable. In the past few decades, people have also begun to consider environmental impacts in some energy-
400
To talk about quantities of energy used, it is helpful to use specific measures. Recall from Chapter 2 that the basic unit of energy is the joule (J). One gigajoule (GJ) is 1 billion (1 × 10⁹) joules, or about as much energy as is contained in 30 L (8 gallons) of gasoline. One exajoule (EJ) is 1 billion (1 × 10⁹) gigajoules. In some figures, we also present the quad, a unit of energy used only by the U.S. government to report energy consumption. The quad is 1 quadrillion, or 1 × 10¹⁵, British thermal units, or Btu. One quad is equal to 1.055 EJ.
Worldwide Patterns of Energy Use
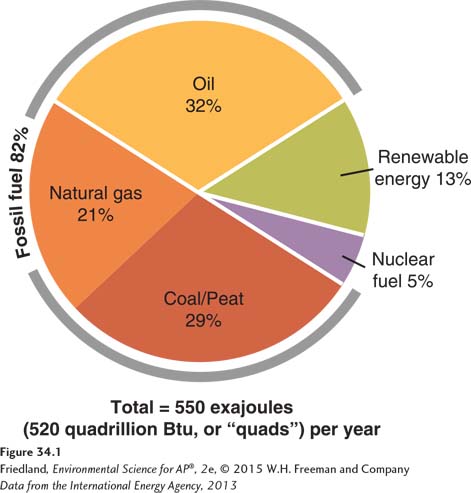
As FIGURE 34.1 shows, in 2011 total world energy consumption was approximately 550 EJ per year. This number amounts to roughly 75 GJ per person per year. Oil, coal, and natural gas were the three largest energy sources. Peat, a precursor to coal, is sometimes combined with coal for reporting purposes in certain countries, mostly in the developing world.
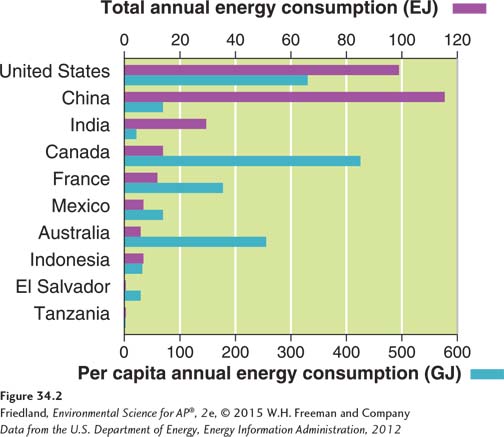
Energy use is not evenly distributed throughout the world. FIGURE 34.2 shows that energy consumption in the United States was 325 GJ per person per year, almost 5 times greater than the world average. In fact, although only 20 percent of the world’s population lives in developed countries, those people use 70 percent of the world’s energy each year. Note that of the countries shown in FIGURE 34.2, China has the greatest total energy consumption, whereas Canada has the greatest per capita energy consumption. At 0.12 EJ per year, Tanzania has the lowest annual energy consumption of the countries shown; annual per capita energy consumption in Tanzania is less than 3 GJ per person per year.
Commercial energy source An energy source that is bought and sold.
Subsistence energy source An energy source gathered by individuals for their own immediate needs.
There are a variety of reasons for the patterns we see in FIGURE 34.2. In developed countries and in urban areas of some developing countries, individuals are likely to use fossil fuels such as coal, oil, and natural gas—
Changes in energy demand generally reflect the level of industrialization in a country or region. As energy demand increases, societies change the types of fuels they use. Today, we see the same patterns of changing energy use in developing countries that have been observed historically in the United States. For example, as more people own automobiles, demand for gasoline and diesel fuel increases. As industries develop and factories are built, demand for electricity and nuclear fuel increases. Although worldwide energy use varies considerably, the United States is a particularly large energy consumer.
401
Patterns of Energy Use in the United States
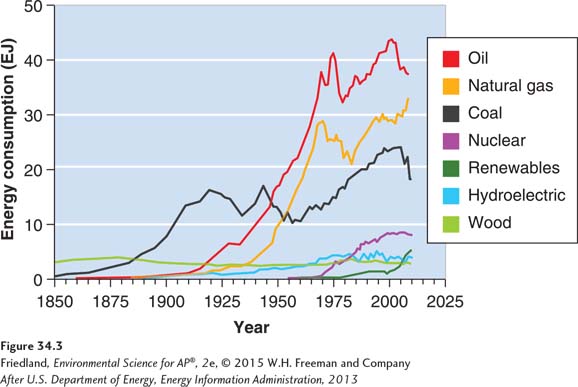
FIGURE 34.3 shows the history of energy use in the United States. Wood was the predominant energy source until about 1875, when coal came into wider use. Starting in the early 1900s, oil and natural gas joined coal as the primary sources of energy. By 1950, electricity generated by nuclear energy became part of the mix, and hydroelectricity became more prominent. The 1970s saw a decline of oil and a resurgence of coal. These changes were the result of political, economic, and environmental factors that will continue to shape energy use into the future. Today, the three resources that supply the majority of the energy used in the United States—
Energy use in the United States today is the result of the inputs and outputs of an enormous system. The boundaries of the system are political and technological as well as physical. For example, oil inputs enter the U.S. energy system from both domestic production and imports from other countries. Hydroelectric energy comes from water that flows within the physical boundaries of the country, as well as from neighboring Canada, but it is not an energy input until we move it into a technological system, such as a hydroelectric dam. One major output from the system is work—
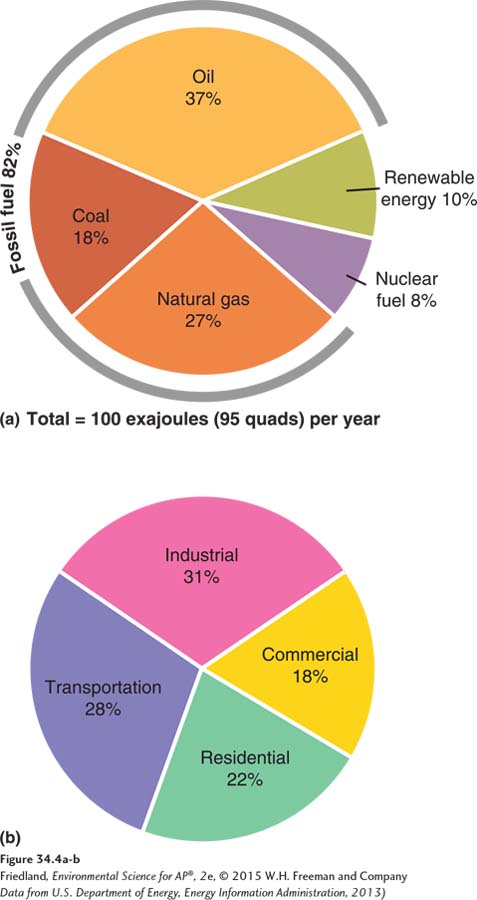
As you can see in FIGURE 34.4, U.S. energy consumption in 2012 was approximately 100 EJ (1.0 × 10¹⁸ J) per year. The energy mix of U.S. consumption is 82 percent fossil fuel, 8 percent nuclear fuel, and 10 percent renewable energy resources. The United States produces 85 percent of the energy it needs, while the remainder—
Energy use varies regionally and seasonally. In the midwestern and southeastern states, coal is the primary fuel burned for electricity generation. The western and northeastern states generate electricity using a mix of nuclear fuels, natural gas, and hydroelectric dams. Highly populated areas tend to use less coal, which creates more air pollution than any other fuel. Regional use of fuel varies according to the climate and the season. Northern areas consume more oil and natural gas during the winter months to meet the demand for heating while southern areas consume more electricity in the summer months to meet the demand for air conditioning.
402
Expanded domestic production of natural gas and oil has led to a rapidly changing energy portfolio in the United States and elsewhere. However, the type of energy used for a particular application is a function of many factors, including its characteristics. Factors to be considered include the ease with which the fuel can be transported and the amount of energy a given mass of the fuel contains.
Different energy forms are best suited for specific purposes
The best form of energy to use depends on the particular purpose for which it is needed. For example, for transportation, we usually prefer gasoline or diesel fuel—
Energy-
Quantifying Energy Efficiency
Although all conventional nonrenewable energy sources have environmental impacts, an understanding of energy efficiency can help us make better energy use decisions. Energy efficiency refers to the efficiency of the process we use to obtain the fuel and the efficiency of the process that converts it into the work that is needed.
In Chapter 2 we discussed energy efficiency as well as energy quality, a measure of the ease with which stored energy can be converted into useful work. The second law of thermodynamics dictates that when energy is transformed, its ability to do work diminishes because some energy is lost during each conversion. In addition to these losses, there is an expenditure of energy involved in obtaining almost every fuel that we use.
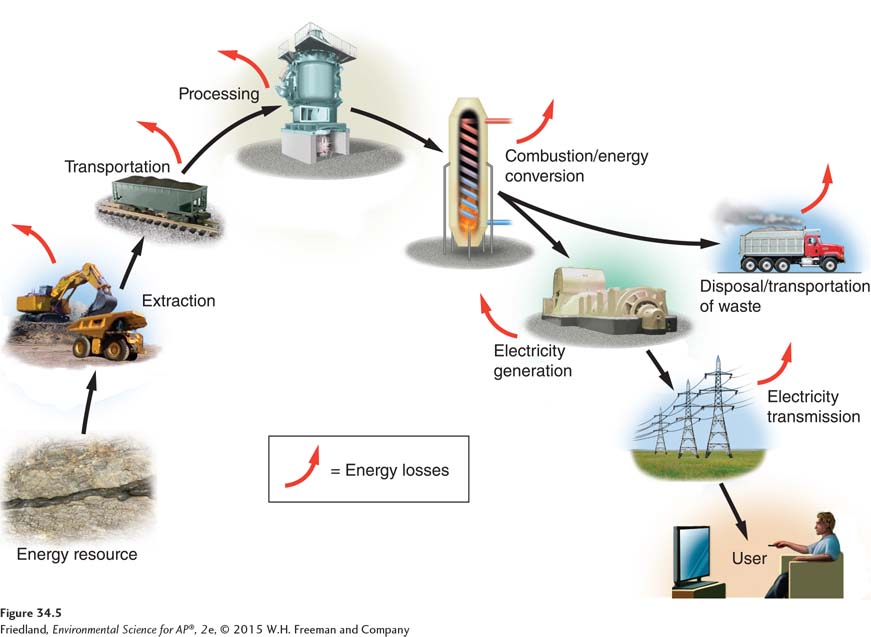
FIGURE 34.5 outlines the process of energy use from extraction of a resource to electricity generation and disposal of waste products from the power plant. The red arrows indicate that there are many opportunities for energy loss, each of which reduces energy efficiency. You may recall that the efficiency of converting coal into electricity is approximately 35 percent (see FIGURE 5.6, on page 48). In other words, about two-
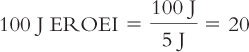
Every energy source, from coal to oil to wind, requires an expenditure of energy to obtain. The most direct way to account for the energy required to produce a fuel, or energy source, is by calculating the energy return on energy investment (EROEI), the amount of energy we get out of an energy source for every unit of energy expended on its production. EROEI is calculated as follows:

For example, in order to obtain 100 J of coal from a surface coal mine, 5 J of energy is expended. Therefore,
As you might expect, a larger value for EROEI suggests a more efficient and more desirable process. “Science Applied 6: Should Corn Become Fuel?” following Chapter 13 calculates the EROEI for ethanol, a fuel made from corn.
Finding the Right Energy Source for the Job
When deciding between two energy sources for a given job, it is essential to consider the overall system efficiency. Sometimes the trade offs are not immediately apparent. The home hot water heater is an excellent illustration of this principle.
403
Electric hot water heaters are often described as being highly efficient. Even though it is very difficult to convert an energy supply entirely to its intended purpose, converting electricity into hot water in a water heater comes very close. That’s because heat, the waste product that usually makes an energy conversion system less efficient, is actually the intended product of the conversion.
If the conversion from electricity to heat occurs inside the tank of water, which is usually the case with electric hot water heaters, very little energy is lost, and we can say the efficiency is 99 percent. By contrast, a typical natural gas water heater, which transfers energy to water with a flame below the tank and vents waste heat and by-
Efficiency and Transportation
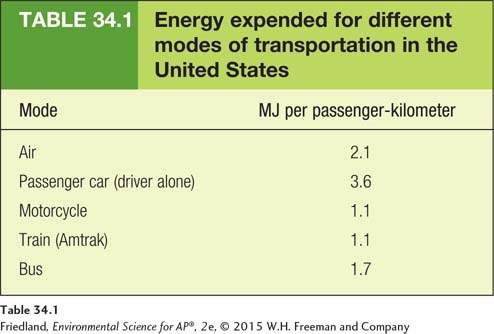
Because nearly 30 percent of energy use in the United States is for transportation, energy efficiency in transportation is particularly important. The movement of people and goods occurs primarily by means of vehicles that are fueled by petroleum products, such as gasoline and diesel fuel, and by electricity. These vehicles contribute to air pollution and greenhouse gas emissions. However, some modes of transportation are more efficient than others.
As you might expect, public transportation—
404
Transportation efficiency calculations do not take into account convenience, comfort, or style. Many people in the developed world are quite particular about how they get from place to place and want the independence of a personal vehicle. They also tend to have strong feelings about what type of personal vehicle is most desirable. In the United States, light trucks—
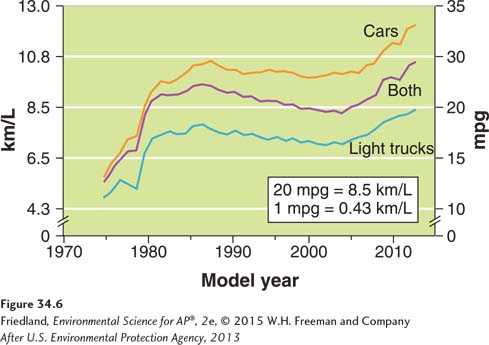
Light trucks are comparatively heavy vehicles and so generally have mileage ratings of less than 8.5 km per liter, or 20 miles per gallon (mpg). Because they are exempt from certain vehicle emission standards, they emit more of certain air pollutants per liter of fuel combusted than passenger cars. Smaller cars with standard internal combustion engines can travel up to 19 km per liter (45 mpg) on the highway. Hybrid passenger cars, which use a gasoline engine, electric motors, and special braking systems, obtain closer to 21 km per liter (50 mpg). Electric cars and plug-
Despite the availability of fuel-
405
Energy efficiency is an important consideration when making fuel and technology choices, but it is not the only factor we must consider. Determining the best fuel for the job is not always easy, and it involves trade offs among convenience, ease of use, safety, cost, and pollution.
Electricity accounts for 40 percent of our energy use
Energy carrier Something that can move and deliver energy in a convenient, usable form to end users.
Because electricity can be generated from many different sources, including fossil fuels, wind, water, and the Sun, it is a form of energy in its own category. Coal, oil, and natural gas are primary sources of energy. Electricity is a secondary source of energy, meaning that we obtain it from the conversion of a primary source. As a secondary source, electricity is an energy carrier—something that can move and deliver energy in a convenient, usable form to end users.
Approximately 40 percent of the energy consumed in the United States is used to generate electricity. But because of conversion losses during the electricity generation process, of that 40 percent, only 13 percent of this energy is available for end uses. In this section we will look at some of the basic concepts and issues related to generating electricity from fossil fuels. Chapter 13 discusses electricity generation from renewable energy sources.
The Process of Electricity Generation
Electricity is produced by conversion of primary sources of energy such as coal, natural gas, or wind. Electricity is clean at the point of use; no pollutants are emitted in your home when you use a light bulb or computer. When electricity is produced by combustion of fossil fuels, however, pollutants are released at the location of its production. And, as we have seen, the transfer of energy from a fuel to electricity is only about 35 percent efficient. Therefore, although electricity is highly convenient, from the standpoint of efficiency of the overall system and the total amount of pollution released, it is more desirable to transfer heat directly to a home with wood or oil combustion, for example, than via electricity generated from the same materials. The energy source that entails the fewest conversions from its original form to the end use is likely to be the most efficient.
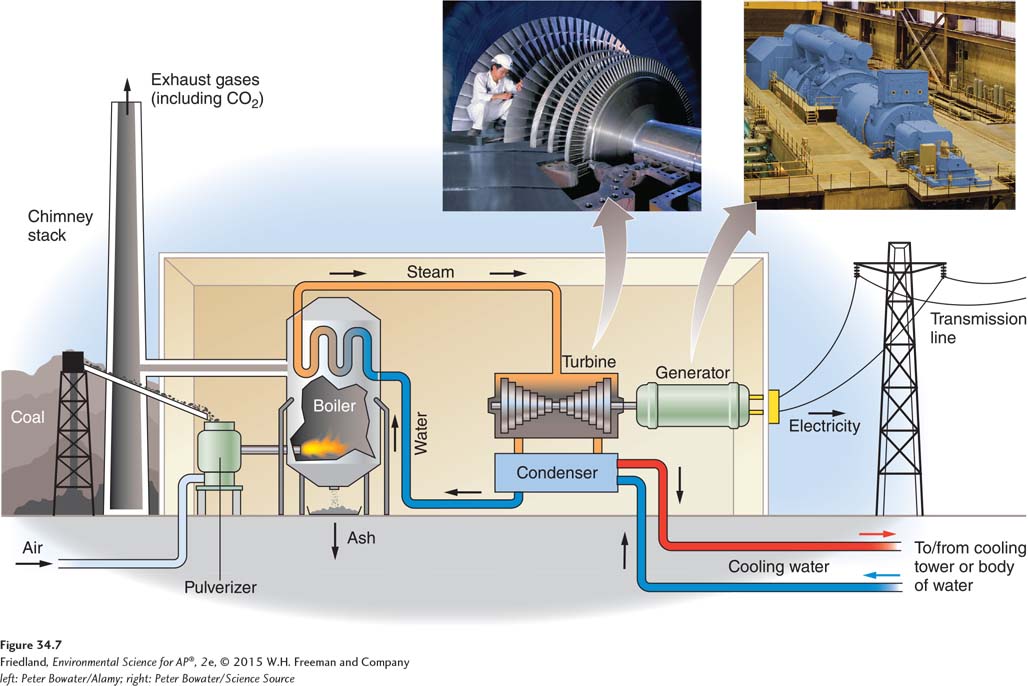
Many types of fossil fuels, as well as nuclear fuels, can be used to generate electricity. Regardless of which fuel is used, all thermal power plants work in the same basic way—
Turbine A device with blades that can be turned by water, wind, steam, or exhaust gas from combustion that turns a generator in an electricity-
Electrical grid A network of interconnected transmission lines that joins power plants together and links them with end users of electricity.
FIGURE 34.7 illustrates the major features of a typical coal-
406
Efficiency of Electricity Generation
Combined cycle A power plant that uses both exhaust gases and steam turbines to generate electricity.
Whereas a typical coal-
Capacity
Capacity In reference to an electricity-
A typical power plant in the United States might have a capacity—its maximum electrical output—
Capacity factor The fraction of time a power plant operates in a year.
Most power plants, however, do not operate every day of the year. They must be shut down for periods of time to allow for maintenance, refueling, or repairs. Therefore, it is useful to measure the amount of time a plant actually operates in a year. This number—
When it is time to start up a power plant, both nuclear and coal-
407
Cogeneration
Cogeneration The use of a fuel to generate electricity and produce heat. Also known as combined heat and power.
The use of a fuel to generate electricity and produce heat is known as cogeneration, also called combined heat and power. Cogeneration is a method employed by certain users of steam for obtaining greater efficiencies. If steam used for industrial purposes or to heat buildings is diverted to turn a turbine first, the user will achieve greater overall efficiency than by generating heat and electricity separately. Cogeneration efficiencies can be as high as 90 percent, whereas steam heating alone might be 75 percent efficient, and electricity generation alone might be 35 percent efficient.
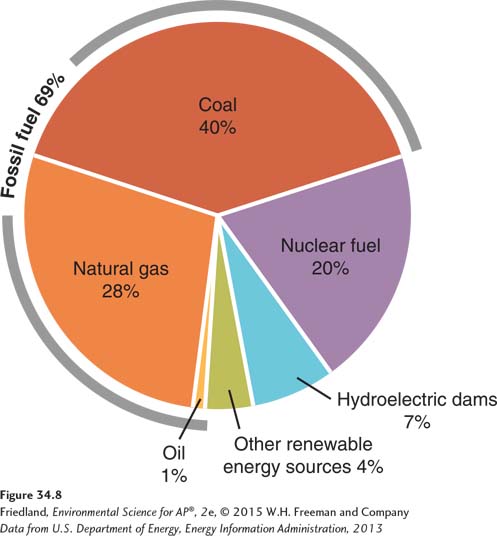
There are over 17,000 power plants in the United States. In 2012, they generated approximately 3.7 billion MWh. FIGURE 34.8 shows the fuels that were used to generate this electricity. As we can see, coal-