module 51 Only Humans Generate Waste
555
Throughout this book, we have examined systems in terms of inputs, outputs, and internal changes. We will begin our discussion of solid waste in the same way—
Learning Objectives
After reading this module, you should be able to
explain why we generate waste and describe recent waste disposal trends.
describe the content of the solid waste stream in the United States.
Humans generate waste that other organisms cannot use
Humans are the only organisms that produce waste others cannot use. To explore this further, we need to learn why materials generated by humans become waste and what that waste contains. Although this seems like a trivial and simple question, it touches upon recent U.S. history, human behavior, and many other topics, including some that go beyond environmental science. We need to establish that waste can be viewed as a system, just like other materials. And it is necessary to describe how we got here—
Waste as a System
Waste Material outputs from a system that are not useful or consumed.
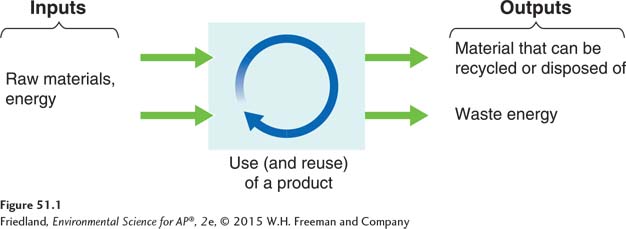
In an ecological system, plant materials, nutrients, water, and energy are the inputs. In a human system, inputs are very similar but contain materials manufactured by humans as well as natural materials. Within this system, humans use these inputs and materials to produce goods. And, as in any system, outputs are generated. We call these outputs waste, which is defined as material outputs that are not useful or are not consumed. Energy waste is also an output. FIGURE 51.1 shows a diagram of the relationship between inputs and outputs in a human system.
556
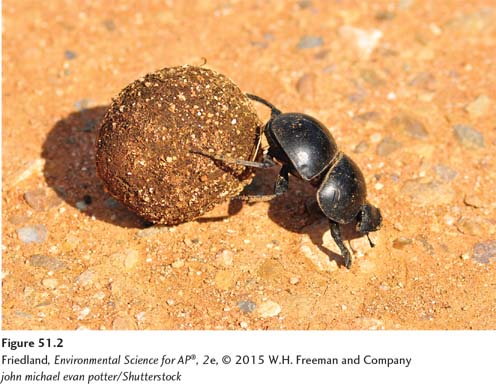
If waste is the nonuseful output of a system, how do we determine what is useful? The detritivores we described in Chapter 3 recycle waste from animals and plants; they use the energy and nourishment they obtain and turn the remainder into compost or humus that nourishes other organisms. Dung beetles, for example, live on the energy and nutrients contained within the dung of elephants and other animals; in the natural world, this is not waste, it is food (FIGURE 51.2). Even humans make use of animal waste—
The Throw-
Until a society becomes relatively wealthy, it generates little waste. Every object that no longer has value for its original purpose becomes useful for another purpose. In 1900 in the United States, virtually all metal, wood, and glass materials were recycled, although no one called it recycling back then. Those who collected recyclables were called junk dealers, or scrap metal dealers. For example, if a wooden bookcase broke and it could not be repaired, the pieces could be used to make a step stool. When the step stool broke, the wood was burned in a wood stove to heat the house. After World War II and with the rapid population growth that occurred in the United States, consumption patterns changed. The increasing industrialization and wealth of the United States, as well as cultural changes, made it possible for people to purchase household conveniences that could be used and then thrown away. Families were large, and people were urged to buy “labor-
Municipal solid waste (MSW) Refuse collected by municipalities from households, small businesses, and institutions.
Refuse collected by municipalities from households, small businesses, and institutions such as schools, prisons, municipal buildings, and hospitals is known as municipal solid waste (MSW). The Environmental Protection Agency (EPA) estimates that approximately 60 percent of MSW comes from residences and 40 percent from commercial and institutional facilities. Other kinds of waste generated in the United States in addition to MSW include agricultural waste, mining waste, and industrial waste. Waste other than MSW is typically deposited and processed on-
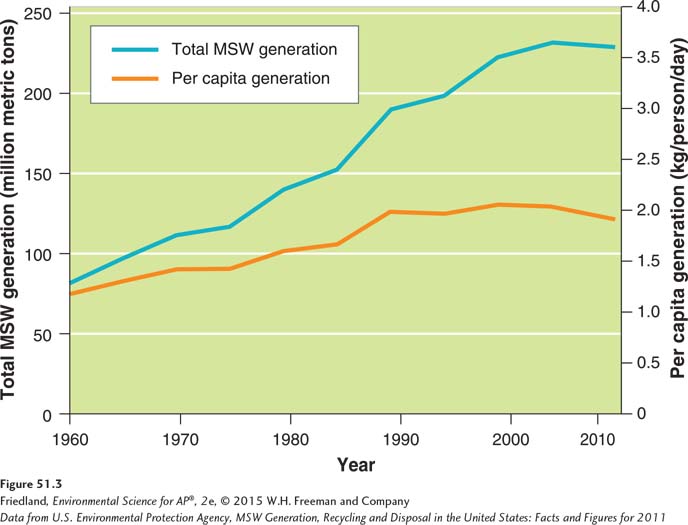
FIGURE 51.3 shows the trend toward greater generation of MSW both overall and on a per capita basis from 1960 to 2011. In the first 47 years of this period, the total amount of MSW generated in the United States increased from 80 million metric tons (88 million U.S. tons) to 227 million metric tons (250 million U.S. tons) per year. In the last several years for which there are data, the total amount of MSW actually decreased by a small amount. The increase for all but the last several years can be explained in part because of population growth and in part because individuals have been generating increasing amounts of MSW. In 2011, average waste generation was 2.0 kg (4.4 pounds) of MSW per person per day. Waste generation varies by season of the year, socioeconomic status of the individual generating the waste, and even geographic location within the country.
Waste generation in much of the rest of the world stands in contrast to the United States. In Japan, for example, each person generates an average of 1.1 kg (2.4 pounds) of MSW each day. The 2010 UN-
557
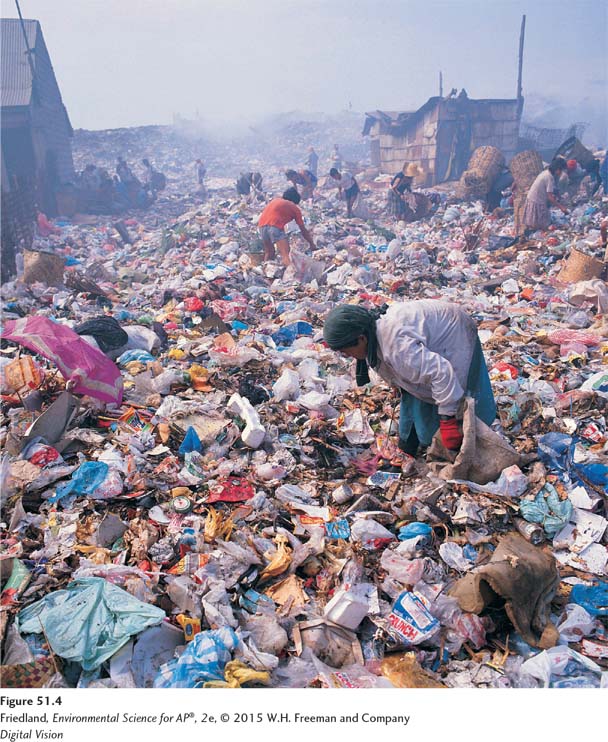
Developing countries have become responsible for a greater portion of global MSW, in part because of their growing populations. In addition, as developing countries produce more of the goods used in the developed world, they generate more waste in the production process for these goods. For example, computers sold to consumers in the United States are assembled in such places as Taiwan, Singapore, and China, and the waste products generated are disposed of at the manufacturing location.
The solid waste stream contains materials from many sources
We have seen that MSW is made up of the things we use and then throw away. The goods that we use are generally a combination of organic items, fibers, metals, and plastics made from petroleum. A certain amount of waste is generated during any manufacturing process. Waste is also generated from the packaging and transporting of goods.
Waste stream The flow of solid waste that is recycled, incinerated, placed in a solid waste landfill, or disposed of in another way.
Depending on the particular materials, products, and goods that consumers use, such items can remain in the consumer-
558
Composition of Municipal Solid Waste
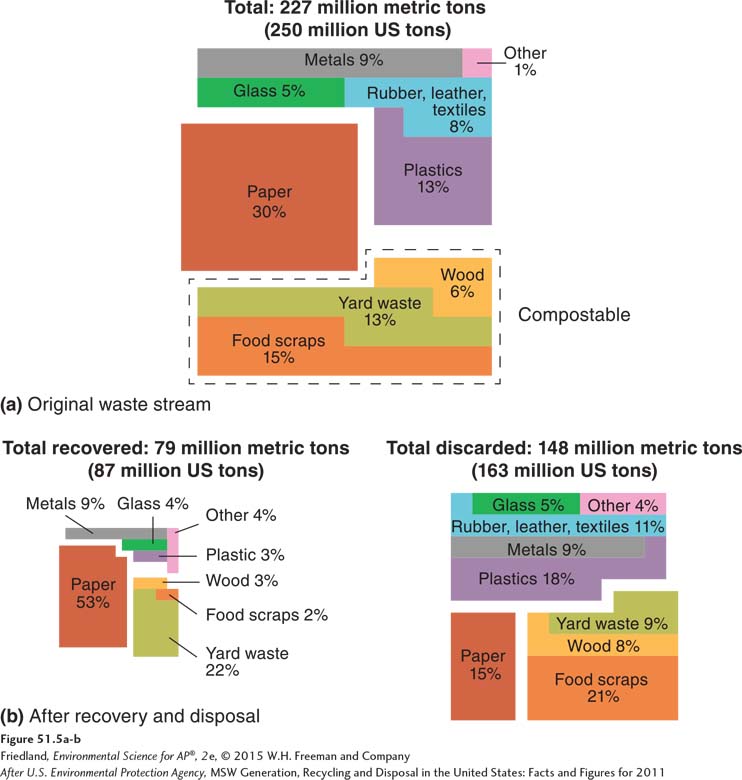
FIGURE 51.5a shows the data for MSW composition in the United States in 2011 by category before any recycling has occurred. The category “paper,” which includes newsprint, office paper, cardboard, and boxboard such as cereal and food boxes, made up 30 percent of the 227 million metric tons (250 million U.S. tons) of waste generated before recycling. The fraction of paper in the solid waste stream has been decreasing; less than a decade ago it was 40 percent of MSW. Organic materials other than paper products make up another large category, with yard waste and food scraps together making up 28 percent of MSW. Wood, which includes construction debris, accounts for another 6 percent. So, not including paper products, which are more easily recycled, roughly 34 percent of current MSW could be composted, although some wood construction debris is difficult to compost because of its size and thickness. The combination of all plastics makes up approximately 13 percent of MSW.
559
As FIGURE 51.5b shows, 35 percent of the material that could potentially end up in a landfill or an incinerator is recovered. More than half of the recovered material is paper. Yard trimmings account for another large portion of recovered material, 22 percent.
After roughly one-
Long-
E-
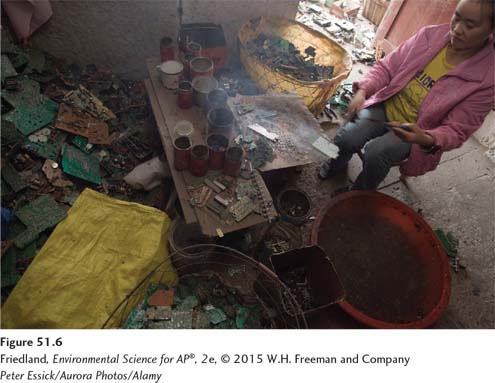
Electronic waste, or e-
In the United States, most electronic devices are not designed to be easily dismantled after they are discarded. It generally costs more to recycle a computer than to put it in a landfill. The EPA estimates that approximately 27 percent of televisions and computer products discarded in 2010 were sent to recycling facilities. Unfortunately, much e-