working toward  sustainability
Using Environmental Indicators to Make a Better City
26
We have seen that environmental indicators can be used to monitor conditions across a range of scales, from local to global. They are also being used by people looking for ways to apply environmental science to the urban planning process in countries as diverse as China, Brazil, and the United States.
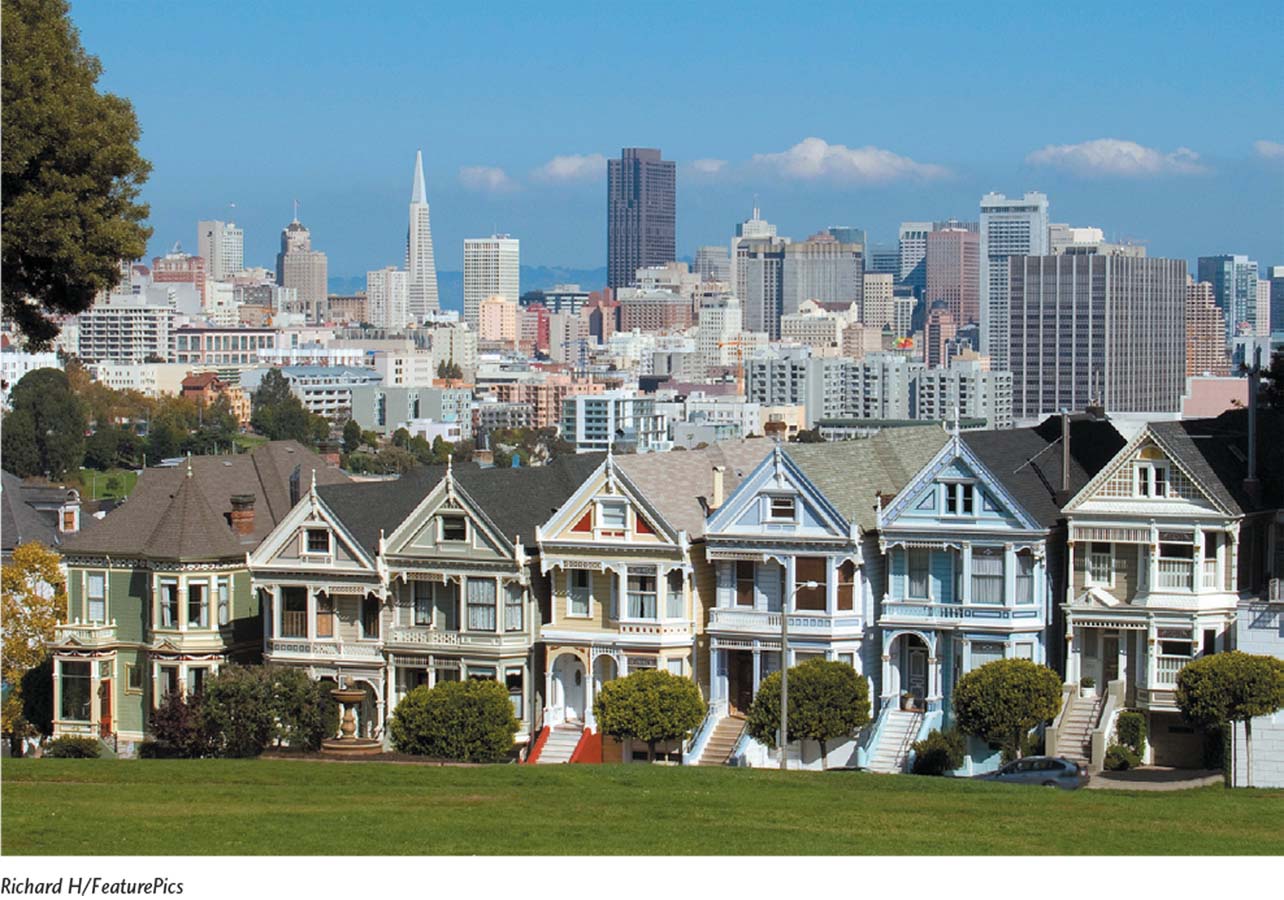
San Francisco, California, is one example. In 1997 the city adopted a sustainability plan to go along with its newly formed Department of the Environment. The San Francisco Sustainability Plan focuses on 10 environmental concerns including air quality; biodiversity; energy, climate change, and ozone depletion; food and agriculture; hazardous materials; human health; parks, open spaces, and streetscapes; solid waste; transportation; and water and wastewater.
Although some of these topics may not seem like components of urban planning, the drafters of the plan recognized that the everyday choices of city dwellers can have wide-
For each of the 10 environmental concerns, the sustainability plan sets out a series of 5-
To monitor the effectiveness of the various actions, San Francisco chose specific environmental indicators for each of the 10 environmental concerns. These indicators had to indicate a clear trend toward or away from environmental sustainability, demonstrate cost effectiveness, be understandable to the nonscientist, and be easily presented to the media. For example, to evaluate biodiversity, San Francisco uses four indicators:
Number of volunteer hours dedicated to managing, monitoring, and conserving San Francisco’s biodiversity
Number of square feet of the worst non-
native species removed from natural areas Number of surviving native plant species planted in developed parks, private landscapes, and natural areas
Abundance and species diversity of birds, as indicated by the Golden Gate Audubon Society’s Christmas bird counts
Together, these indicators provide a relatively inexpensive and simple way to summarize the level of biodiversity, the threat to native biodiversity from non-
More than 15 years later, what do the indicators show? In general, there has been a reasonable amount of improvement. For example, in the category of solid waste, San Francisco has increased the amount of waste recycled from 30 to 70 percent, with a goal of 75 percent by 2020, and it now has the largest urban composting program in the country. San Francisco has also improved its air quality, reducing the number of days in which fine particulate matter exceeded the EPA air quality safe level from 27 days in 2000 to 8 days in 2011.These and other successes have won the city numerous accolades: It has been selected as one of “America’s Top Five Cleanest Cities” by Reader’s Digest and as one of the “Top 10 Green Cities” by The Green Guide. In 2013, San Francisco was named the most sustainable city in the United States by a Toronto-
Critical Thinking Questions
How do the indicators used by a city or metropolitan region differ from the global indicators we described earlier in the chapter?
Think about a city you have lived in or visited. What features might you recommend for a sustainability plan for that location?
References
http:/
http:/