module 65 Sustainability and Economics
703
Sustainability is a relatively new and evolving concept in contemporary environmental science. We have seen that something is sustainable when it meets the needs of the present generation without compromising the ability of future generations to meet their own needs. Although human needs can be defined in various ways, for our purposes we identify the basic necessities as access to food, water, shelter, education, and a healthy, disease-
Well-
The quest to obtain resources and increase well-
Learning Objectives
After reading this module you should be able to
explain why efforts to achieve sustainability must consider both sound environmental science and economic analysis.
describe how economic health depends on the availability of natural capital and basic human welfare.
Achieving sustainability requires both sound environmental science and economic analysis
704
Economics The study of how humans allocate scarce resources in the production, distribution, and consumption of goods and services.
In an attempt to reduce environmental harm, researchers and policy makers have experimented with a variety of techniques to encourage consumers to change their behavior in ways that would benefit the environment. We explored some of these techniques in Chapter 10 where we discussed externalities and in Chapter 15 where we discussed the buying and selling of air pollution allowances as well as charging a fee or tax for the use of certain resources or for the emission of certain pollutants. Economics is the study of how humans allocate scarce resources in the production, distribution, and consumption of goods and services.
Throughout this text we have already applied many concepts from the field of economics. When we looked at the problem of externalities and pollution, we were using economic theory. Life-
Supply, Demand, and the Market
In today’s world, most economies are market economies. In the simplest sense, a market occurs wherever people engage in trade. In a market economy, the cost of a good is determined by supply and demand. When a good is in great demand and wanted by many people, producers are typically unable to provide an unlimited supply of that good. Price is the method that producers and consumers use to communicate the value of an item and to allocate the scarce item.
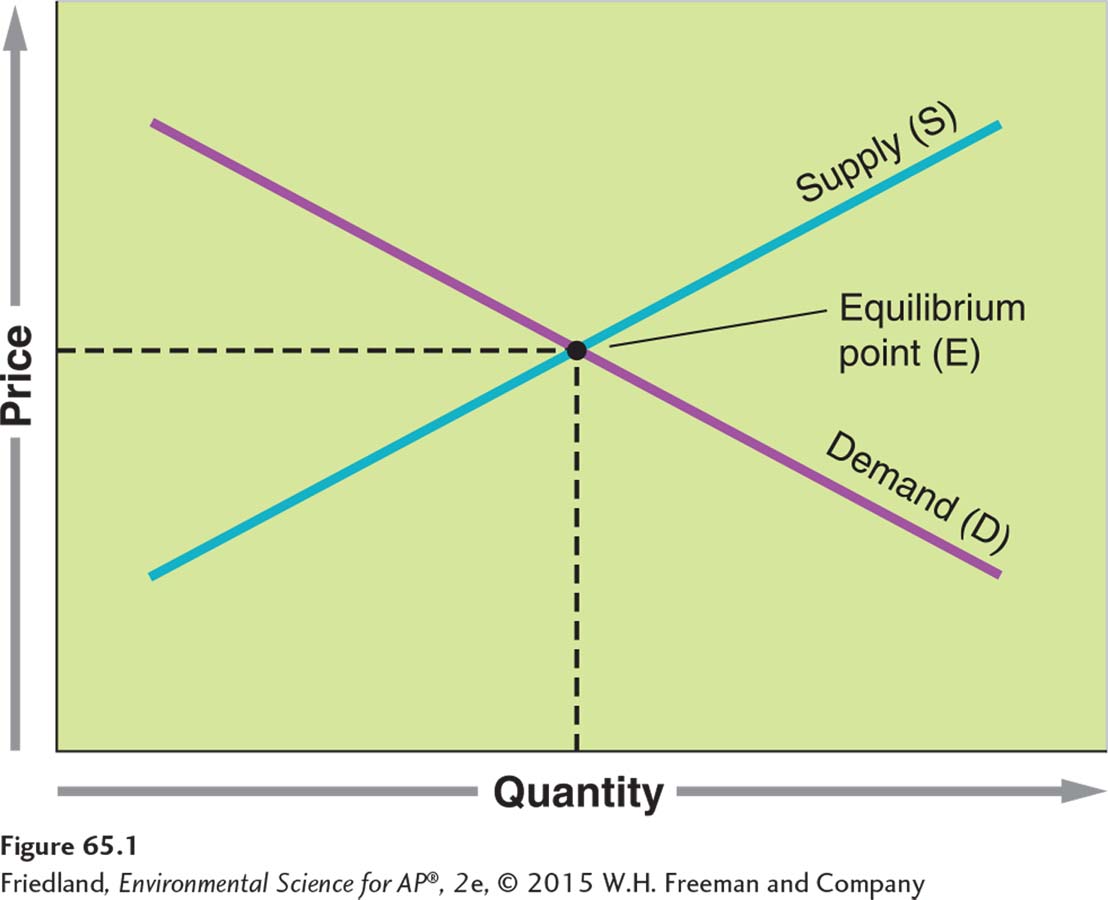
The graph shown in FIGURE 65.1 illustrates the relationship between supply, demand, and price. The supply curve (S) shows how many units that suppliers of a given product or service—
The demand curve (D) shows how much of a good consumers want to buy. Factors that influence demand include income, prices of related goods, tastes, expectations, and the number of people who want the good. For example, if your boss gives you a raise, you may feel like you can afford that T-
Notice that the demand curve slopes downward. In other words, as the price of T-
The laws of supply and demand make intuitive sense. After all, if you are selling T-
With these different interests, how do demand and supply ever meet? In a market system, without any restrictions such as taxes or other regulations, the price of a good will come to an equilibrium point (E) where the two curves on the graph intersect. Here the quantity demanded and the quantity supplied are exactly equal. At this price, suppliers find it worthwhile to supply exactly as many T-
705
Unfortunately, markets—
Let’s look at the example of coal. The dollar cost of coal-
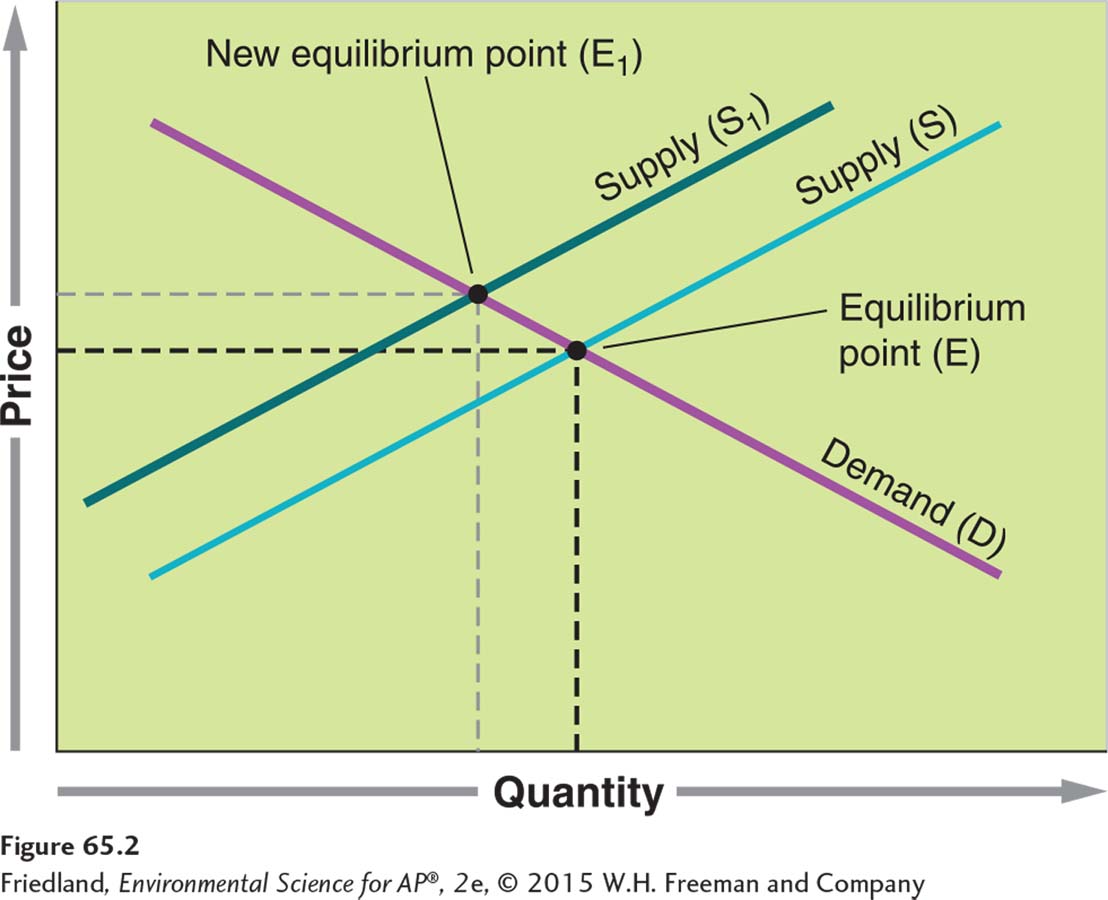
If the dollar cost of a good included externalities such as the expenses incurred by emitting pollutants into the air, or the expenses related to removing the pollutants before they were emitted, then the cost for most items produced would be greater. This could only occur if a tax were imposed by a regulatory agency. When the cost of production rises due to this tax, the supply curve shifts to the left, from S to S1 as shown in FIGURE 65.2. The new market equilibrium (E1) is at a higher cost and, as a result, fewer items are manufactured and purchased. In other words, including the externalities raises the price and lowers the demand. Therefore the price that includes externalities is more reflective of the true cost of the item.
Measuring Wealth and Productivity
There are a variety of ways of measuring wealth and productivity. While there is no consensus on which method is most accurate and each has shortcomings, researchers do agree that measuring wealth and productivity can be a useful way of examining the health of an economy. In this section we will look at the most common and widely accepted measure of wealth and productivity and then look at alternatives.
GDP
Economists use different national economic measurements to gauge the economic wealth of a country in terms of its productivity and consumption. Most of them do not take externalities into account. The most common of these measurements is the gross domestic product (GDP), which refers to the value of all products and services produced in a year in a given country. GDP includes four types of spending: consumer spending, investments, government spending, and exports minus imports. As a measure of well-
Some social scientists maintain that the best way to improve the global environment is to increase the GDP in the less developed world. In Chapter 7 we examined the relationship between rising income and falling birth rates; as GDP increases, population growth slows. This, in turn, should lead to a reduction in anthropogenic environmental degradation. Wealthier, developed countries are able to purchase goods and services that will lead to environmental improvements—
The GPI
706
Genuine progress indicator (GPI) A measure of economic status that includes personal consumption, income distribution, levels of higher education, resource depletion, pollution, and the health of the population.
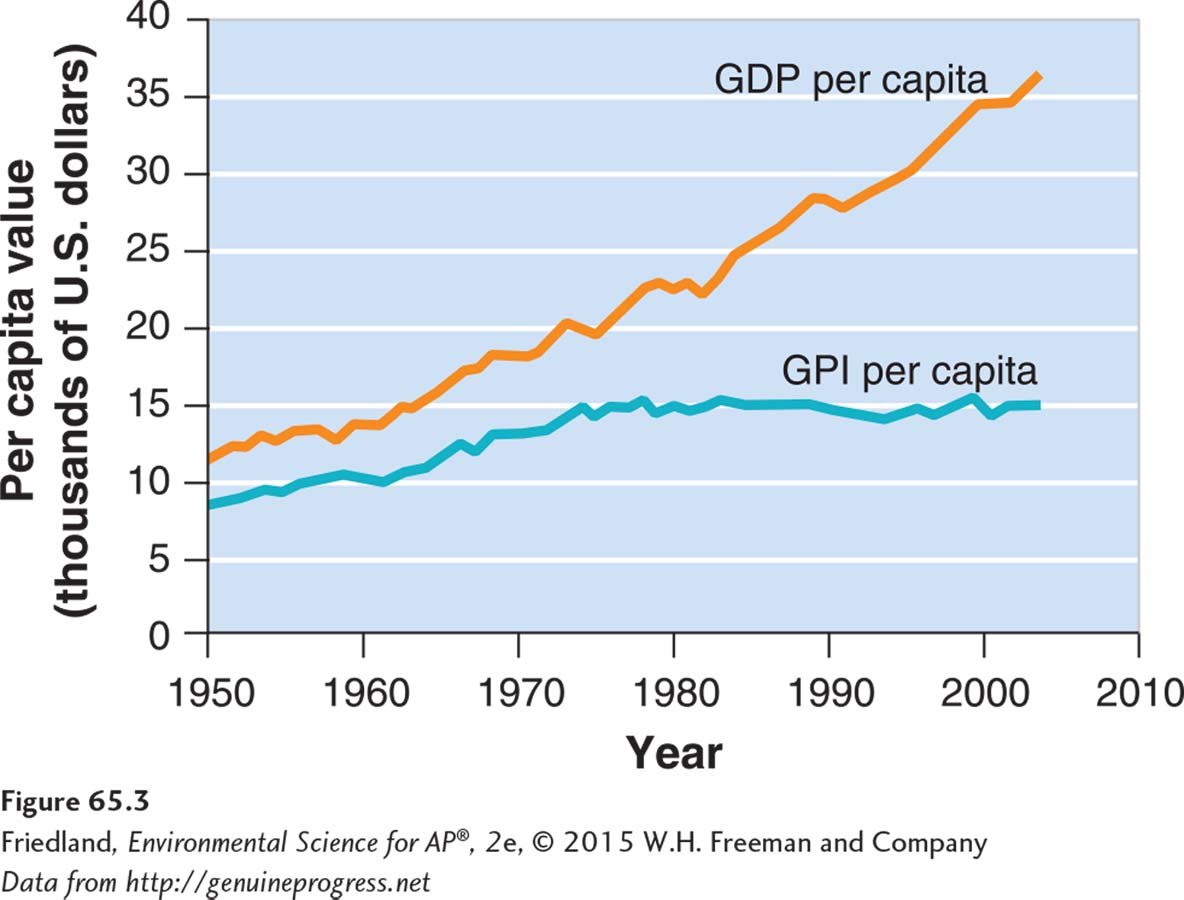
We have seen that GDP is an incomplete measurement of the economic status of a country because it only considers production. Some researchers attempt to address this shortcoming by using another measurement that is known as the genuine progress indicator. The genuine progress indicator (GPI) is a measure of economic status that includes personal consumption, income distribution, levels of higher education, resource depletion, pollution, and the health of the population. As shown in FIGURE 65.3, while GDP in the United States rose steadily from 1950 through 2004, GPI has been virtually level since about 1980. A number of countries, including England, Germany, and Sweden, have recalculated their GDP using the GPI. They have found that their overall wealth, when human and environmental welfare are included, has steadily declined over the last 3 decades.
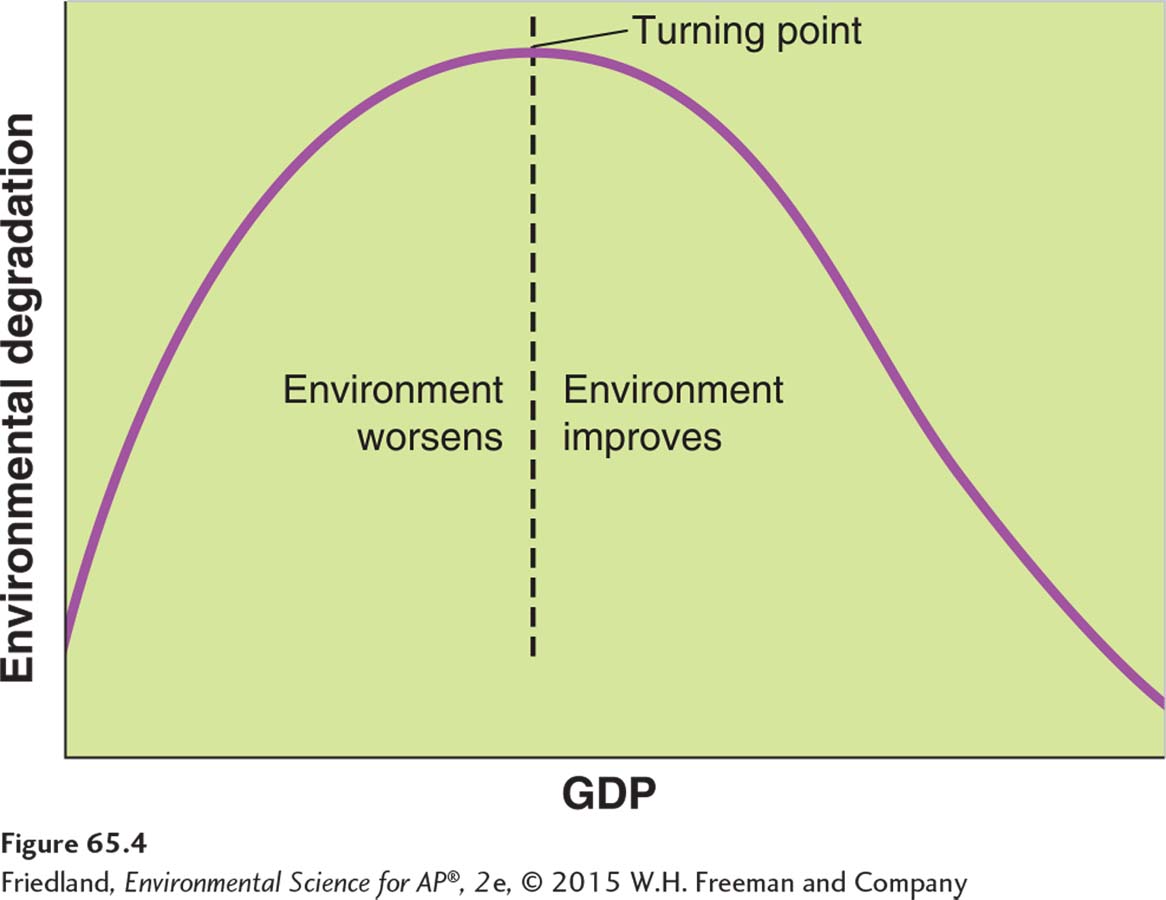
The Kuznets Curve
To address some of the shortcomings of GDP as a measurement of wealth, some environmental economists and scientists advocate using a model known as the Kuznets curve. The Kuznets curve, shown in FIGURE 65.4, suggests that as per capita income in a country increases, environmental degradation first increases and then decreases. The model is controversial because it is not easily applicable to all situations. For example, despite the increasing affluence of developed countries, carbon dioxide emissions and municipal solid waste (MSW) generation have both continued to increase. It is possible that these developed countries are not yet wealthy enough to deal with these problems effectively, but it is also possible that there are certain problems that cannot be solved simply with greater wealth. For example, as countries become wealthier, residents tend to use more fossil fuel for travel, to consume more resources, and to generate more waste.
Technology transfer The phenomenon of less developed countries adopting technological innovations developed in wealthy countries.
Leapfrogging The phenomenon of less developed countries using new technology without first using the precursor technology.
Sometimes less developed countries experience technological leaps without going through each phase of technological development. These kinds of changes may influence the shape of the Kuznets curve or influence how well it characterizes a given situation. Technology transfer happens when less developed countries adopt technological innovations that were developed in wealthy countries. For example, in many less developed countries, a significant proportion of the population uses cell phones without ever having had access to a network of landline telephones. A situation in which less developed countries use new technology without first using the precursor technology is known as leapfrogging. Leapfrogging occurs whenever new technology develops in a way that makes the older technology unnecessary or obsolete. This allows the developing nations to take advantage of the expensive research, development, and experience of the more developed nations.
707
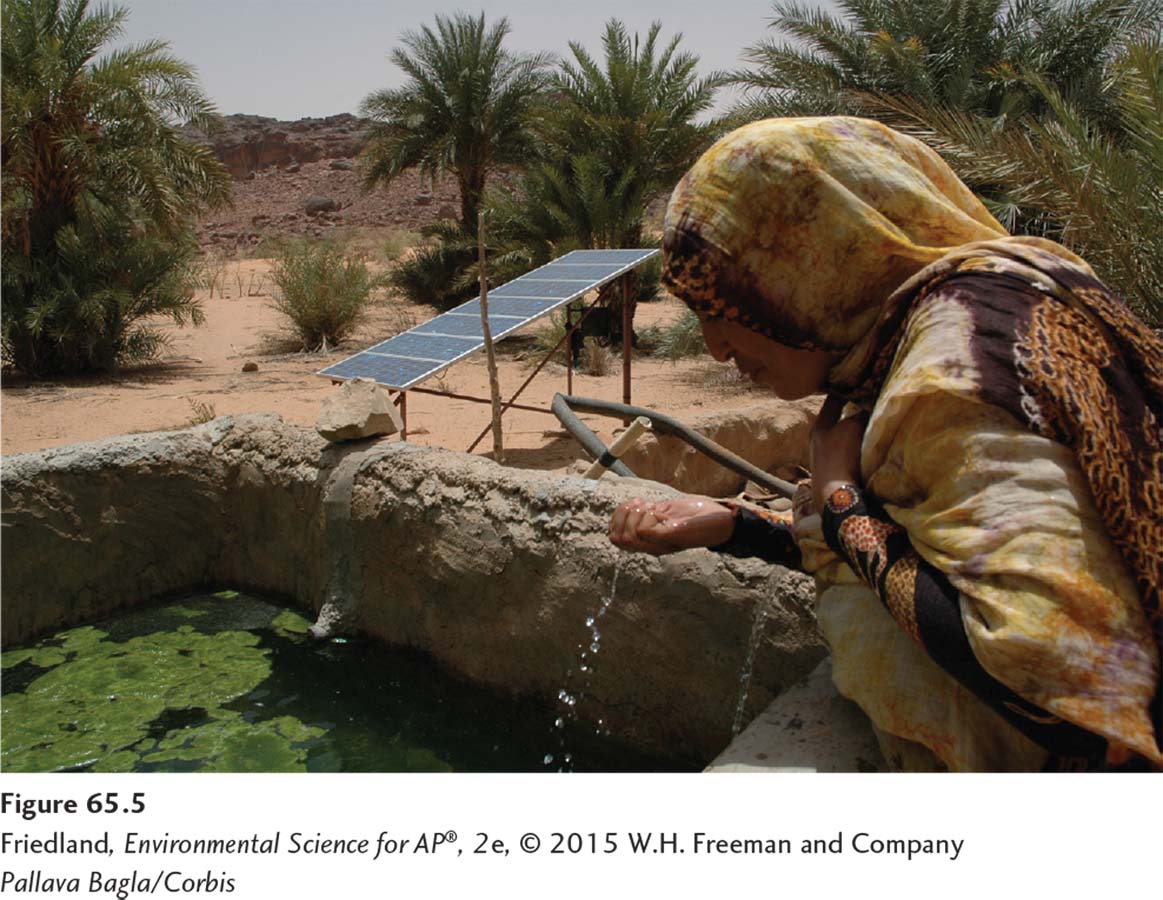
Solar energy is a particularly good example of leapfrogging. In industrialized nations, solar electricity has not been cost-
Economic health depends on the availability of natural capital and basic human welfare
Natural capital The resources of the planet, such as air, water, and minerals.
Human capital Human knowledge and abilities.
Manufactured capital All goods and services that humans produce.
Capital, or the totality of our economic assets, is typically divided into three categories: natural, human, and manufactured. Natural capital refers to the resources of the planet, such as air, water, and minerals. Human capital refers to human knowledge and abilities. Manufactured capital refers to all goods and services that humans produce. While economists usually base their assessment of national wealth on productivity and consumption, environmental scientists point out that all economic systems require a foundation of natural capital. Without natural capital, humans would not be able to produce very much and would probably not survive.
Environmental and Ecological Economics
Market failure When the economic system does not account for all costs.
Environmental economics A subfield of economics that examines the costs and benefits of various policies and regulations that seek to regulate or limit air and water pollution and other causes of environmental degradation.
Ecological economics The study of economics as a component of ecological systems.
Some advocates of a purely free-
Valuation The practice of assigning monetary value to intangible benefits and natural capital.
Environmental and ecological economists attempt to assign monetary value to intangible benefits and natural capital, a practice known as valuation. For example, they have developed methods for assessing the monetary value of a pristine nature preserve, a spotted owl, or a scenic view. One method is to calculate the revenue generated by people who pay for the benefit—
708
Given all of the natural capital and ecological services distributed around the world, it is quite likely that human activities will generate multiple negative externalities. Economic tools can be used to incorporate the dollar cost of the externalities in the price of goods and services. We have seen examples of this with our discussions of charging for allowances to allow sulfur dioxide and carbon dioxide emissions. These economic tools can be used in many other ways as well. Typically, a tax or regulation calls for reducing externalities through a market-
Sustainable Economic Systems
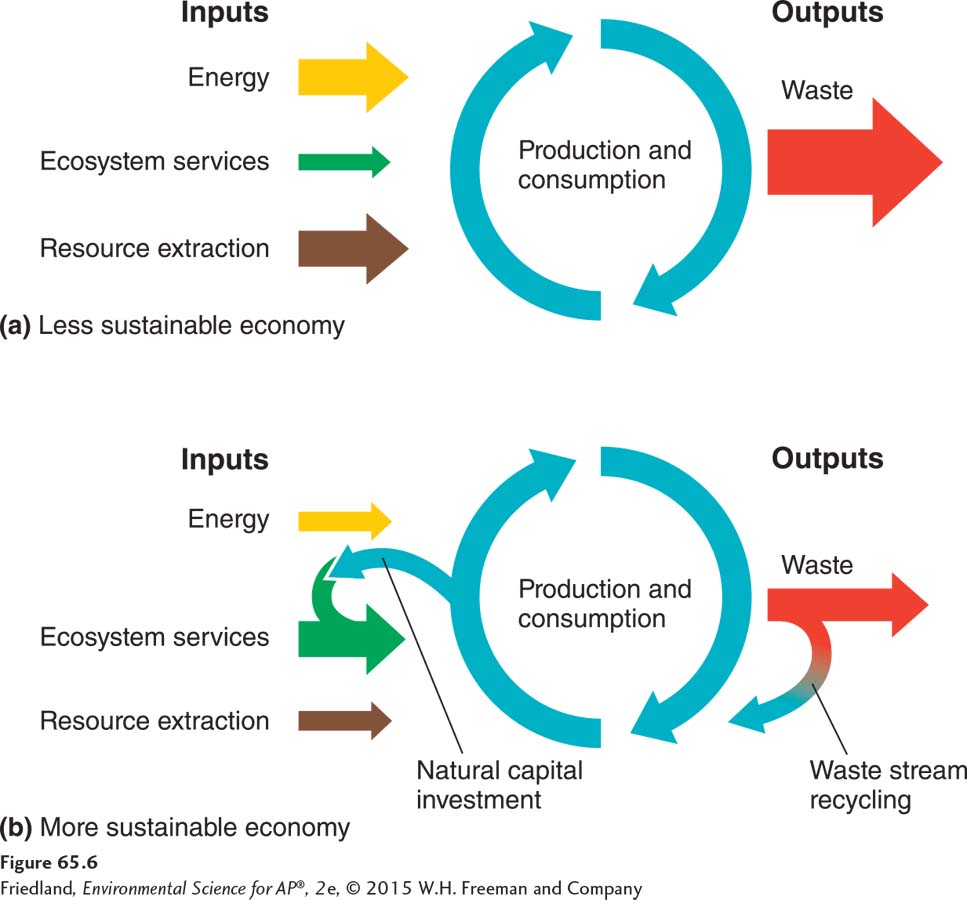
Critics of our current economic system maintain that it is based on maximizing the utilization of resources, energy, and human labor. This encourages the extraction of large amounts of natural resources and does not provide any incentives that would reduce the amount of waste generated. A system analysis of the current economic situation, shown in FIGURE 65.6a, suggests that continuing with such a system is not sustainable. In the current system, large amounts of extracted resources and energy and relatively small amounts of ecosystem services are the inputs and large amounts of waste are the outputs.
709
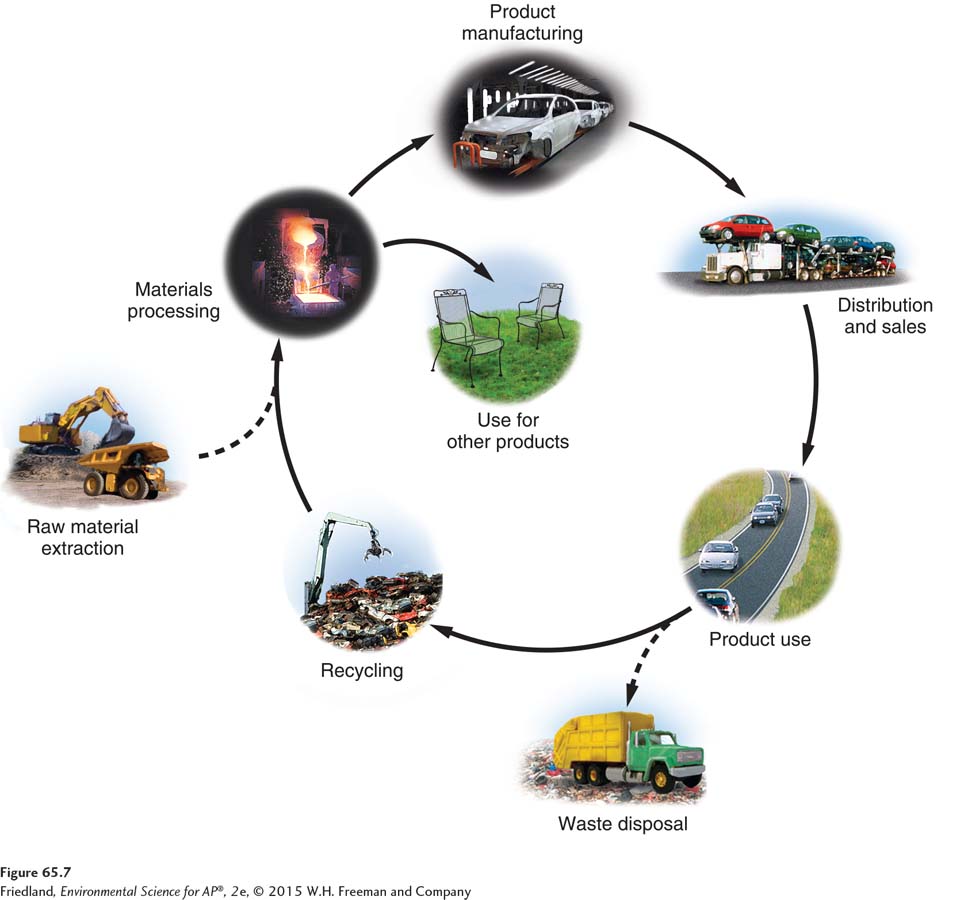
A sustainable economic system, depicted in FIGURE 65.6b, will rely more on ecosystem services and reuse of existing manufactured materials and less on resource extraction. In this system, there is greater reliance on ecosystem services and less reliance on resource extraction that requires energy. It also takes some of the waste stream and reuses it in the production and consumption cycle, as indicated by the arrow labeled “Waste stream recycling.” Therefore, the cycle in FIGURE 65.6b would use more renewable energy, lessen negative externalities, and reuse more of the products that were destined for the waste stream. This model has led architects, environmental scientists, and engineers to a collaborative discussion of the optimal way to design, manufacture, use, and dispose of objects such as automobiles, houses, and consumer goods. Currently, a consumer purchases an object, such as an automobile or computer, and when that object has reached the end of its useful life, the consumer is responsible for its disposal. As we pointed out in Chapter 16, because the responsibility for the object rests with the consumer, there is no incentive for the manufacturer to make it easy to reuse or recycle the object. Some observers of the current situation have noted the irony that a can of a chemical oven cleaner purchased for $5 may cost $20 for disposal. These kinds of discussions have led to the cradle-
Because the cradle-