module 6 The Movement of Energy
To understand how an ecosystem functions and the relationship of its biotic and abiotic components, we must first study how energy moves through the ecosystem. In this module we will examine how we delineate ecosystems so that we can examine the movement of energy. We will then consider how photosynthesis and respiration capture and release energy. Finally, we will look at how energy moves through the different components of the ecosystem.
Learning Objectives
After reading this module you should be able to
explain the concept of ecosystem boundaries.
describe the processes of photosynthesis and respiration.
distinguish among the trophic levels that exist in food chains and food webs.
quantify ecosystem productivity.
explain energy transfer efficiency and trophic pyramids.
Ecosystem boundaries are not clearly defined
The characteristics of any given ecosystem are highly dependent on the climate that exists in that location on Earth. For example, ecosystems in the dry desert of Death Valley, California, where temperatures may reach 50°C (120°F), are very different from those on the continent of Antarctica, where temperatures may drop as low as –85°C (–120°F). Similarly, water can range from being immeasurable in deserts to being the defining feature of the ecosystem in lakes and oceans. On less extreme scales, small differences in precipitation and the ability of the soil to retain water can favor different terrestrial ecosystem types. Regions with greater quantities of water in the soil can support trees, whereas regions with less water in the soil can support only grasses.
The biotic and abiotic components of an ecosystem provide the boundaries that distinguish one ecosystem from another. Some ecosystems have well-
70
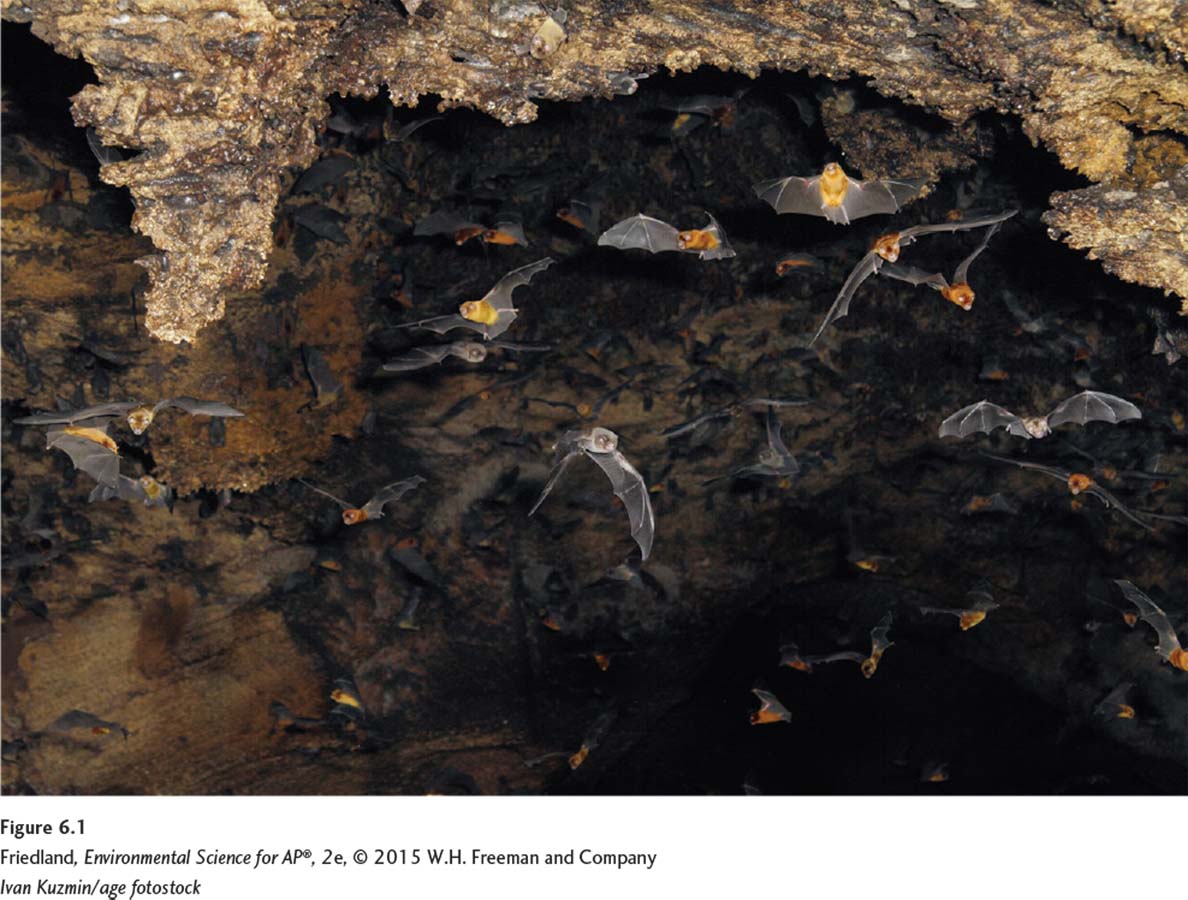
The cave ecosystem is relatively easy to study because its boundaries are clear. With the exception of the bats feeding outside the cave, the cave ecosystem is easily defined as everything from the point where the stream enters the cave to the point where it exits. Likewise, many aquatic ecosystems, such as lakes, ponds, and streams, are relatively easy to define because the ecosystem’s boundaries correspond to the boundaries between land and water. Knowing the boundaries of an ecosystem makes it easier to identify the system’s biotic and abiotic components and to trace the cycling of energy and matter through the system.
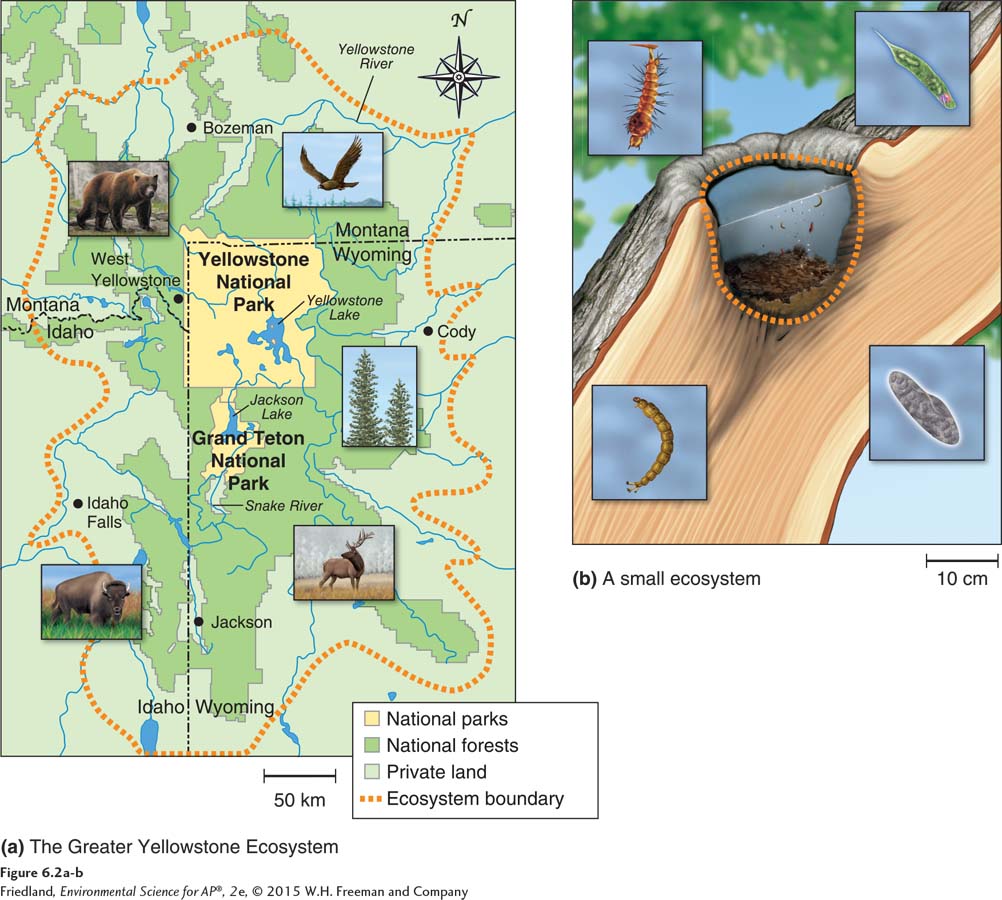
In most cases, however, determining where one ecosystem ends and another begins is difficult. For this reason, ecosystem boundaries are often subjective. Environmental scientists might define a terrestrial ecosystem as the range of a particular species of interest, such as the area where wolves roam, or they might define it by using topographic features, such as two mountain ranges enclosing a valley. The boundaries of some managed ecosystems, such as national parks, are set according to administrative rather than scientific criteria. Yellowstone National Park, for example, was once managed as its own ecosystem until scientists began to realize that many species of conservation interest, such as grizzly bears (Ursus arctos horribilis), spent time both inside and outside the park, despite the park’s massive area of 898,000 ha (2.2 million acres). To manage these species effectively, scientists had to think much more broadly; they had to include nearly 20 million ha (50 million acres) of public and private land outside the park. This larger region, shown in FIGURE 6.2a, was named the Greater Yellowstone Ecosystem. As the name suggests, the actual ecosystem extends well beyond the administrative boundaries of the park.
71
As we saw in Chapter 2, not all ecosystems are as vast as the Greater Yellowstone Ecosystem. Some can be quite small, such as a water-
Although it is helpful to divide locations on Earth into distinct ecosystems, it is important to remember that each ecosystem interacts with surrounding ecosystems through the exchange of energy and matter. Organisms such as bats—
Biosphere The region of our planet where life resides, the combination of all ecosystems on Earth.
The combination of all ecosystems on Earth forms the biosphere, which is the region of our planet where life resides. It forms a 20-
Photosynthesis captures energy and respiration releases energy
To understand how ecosystems function and how best to protect and manage them, ecosystem ecologists also study the processes that move energy and matter within an ecosystem. To understand energy relationships, we need to look at the way energy flows across an ecosystem.
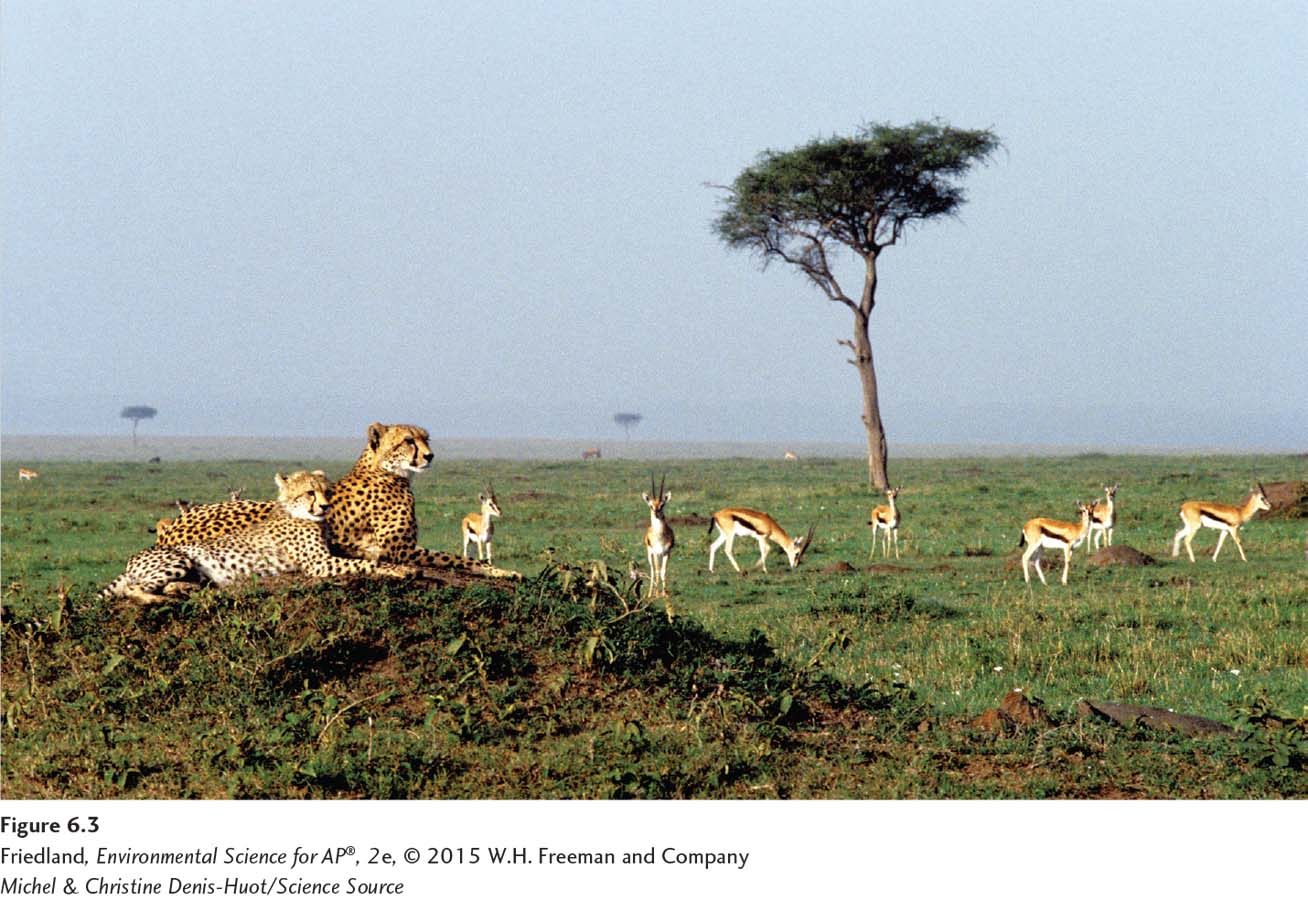
Consider the Serengeti Plain in East Africa (FIGURE 6.3). Plants, such as grasses and acacia trees, absorb energy directly from the Sun. That energy spreads throughout an ecosystem as plants are eaten by animals, such as gazelles, and the animals are subsequently eaten by predators, such as cheetahs. There are millions of herbivores, such as zebras and wildebeests, in the Serengeti ecosystem, but far fewer carnivores, such as lions (Panthera leo) and cheetahs (Acinonyx jubatus), that feed on herbivores. In accordance with the second law of thermodynamics, when one organism consumes another, not all of the energy in the consumed organism is transferred to the consumer. Some of that energy is lost as heat. Therefore, all the carnivores in an area contain less energy than all the herbivores in the same area because all the energy going to the carnivores must come from the animals they eat. Let’s trace this energy flow in more detail by looking at the processes of photosynthesis and cellular respiration.
Photosynthesis
Producer An organism that uses the energy of the Sun to produce usable forms of energy. Also known as Autotroph.
Photosynthesis The process by which producers use solar energy to convert carbon dioxide and water into glucose.
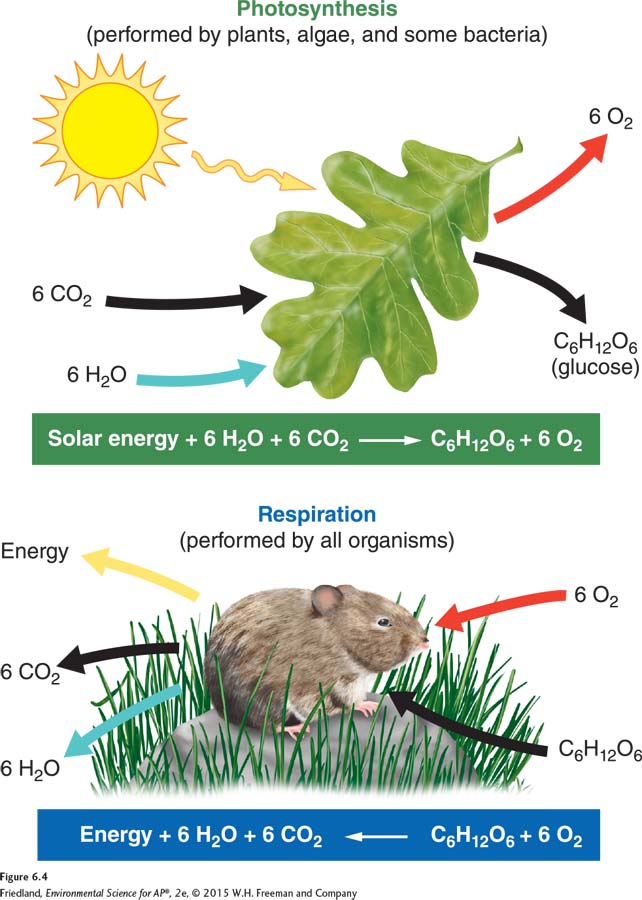
Nearly all of the energy that powers ecosystems comes from the Sun as solar energy, which is a form of kinetic energy. Plants, algae, and some bacteria that use the Sun’s energy to produce usable forms of energy are called producers, or autotrophs. As you can see in the top half of FIGURE 6.4, these producers use photosynthesis, which means they use solar energy to convert carbon dioxide (CO2) and water (H2O) into glucose (C6H12O6). Glucose is a form of potential energy that can be used by a wide range of organisms. The photosynthesis process also produces oxygen (O2) as a waste product. That is why plants and other producers are beneficial to our atmosphere; they produce the oxygen we need to breathe.
72
Cellular Respiration
Cellular respiration The process by which cells unlock the energy of chemical compounds.
Aerobic respiration The process by which cells convert glucose and oxygen into energy, carbon dioxide, and water.
Anaerobic respiration The process by which cells convert glucose into energy in the absence of oxygen.
Producers use the glucose they produce by photosynthesis to store energy and to build structures such as leaves, stems, and roots. Other organisms, such as the herbivores on the Serengeti Plain, eat the tissues of producers and gain energy from the chemical energy contained in those tissues. They do this through cellular respiration, a process by which cells unlock the energy of chemical compounds. Aerobic respiration, which is shown in the bottom half of FIGURE 6.4, is the opposite of photosynthesis; cells convert glucose and oxygen into energy, carbon dioxide, and water. In essence, organisms conducting aerobic respiration run photosynthesis backward to recover the solar energy stored in glucose. Some organisms, such as bacteria that live in the mud underlying a swamp where oxygen is not available, conduct anaerobic respiration, a process by which cells convert glucose into energy in the absence of oxygen. Anaerobic respiration does not provide as much energy as aerobic respiration.
Many organisms—
Energy captured by producers moves through many trophic levels
Consumer An organism that is incapable of photosynthesis and must obtain its energy by consuming other organisms. Also known as Heterotroph.
Herbivore A consumer that eats producers. Also known as Primary consumer.
Carnivore A consumer that eats other consumers.
Secondary consumer A carnivore that eats primary consumers.
Tertiary consumer A carnivore that eats secondary consumers.
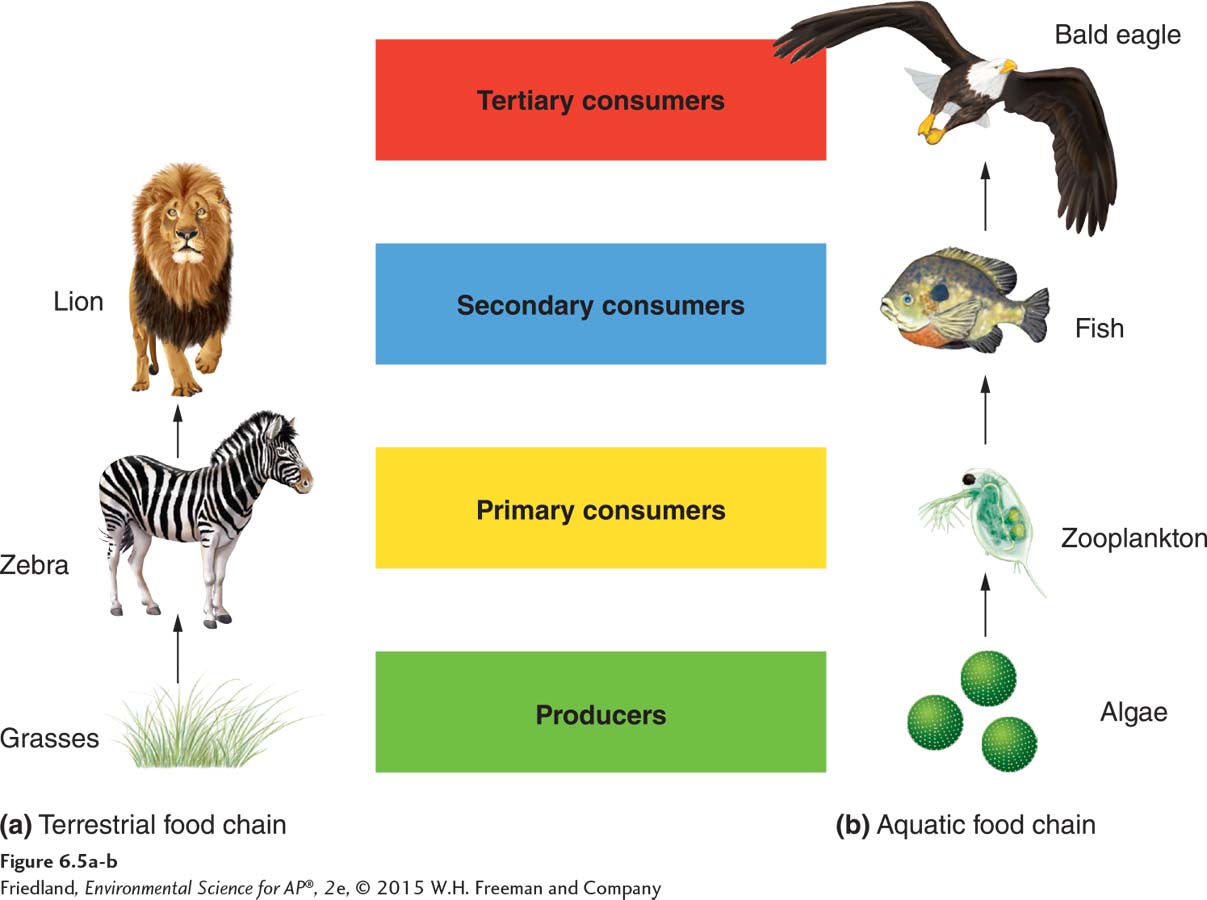
We have seen that producers make their own food. However, consumers, or heterotrophs, are incapable of photosynthesis and must obtain their energy by consuming other organisms. In FIGURE 6.5, we can see that consumers in both terrestrial and aquatic ecosystems fall into different categories. Consumers that eat producers are called herbivores or primary consumers. Primary consumers include a variety of familiar plant-
73
Trophic levels The successive levels of organisms consuming one another.
Food chain The sequence of consumption from producers through tertiary consumers.
The successive levels of organisms consuming one another are known as trophic levels (from the Greek word trophe, which means “nourishment”). The sequence of consumption from producers through tertiary consumers is known as a food chain, where energy moves from one trophic level to the next. A food chain helps us visualize how energy and matter move between trophic levels.
Food web A complex model of how energy and matter move between trophic levels.
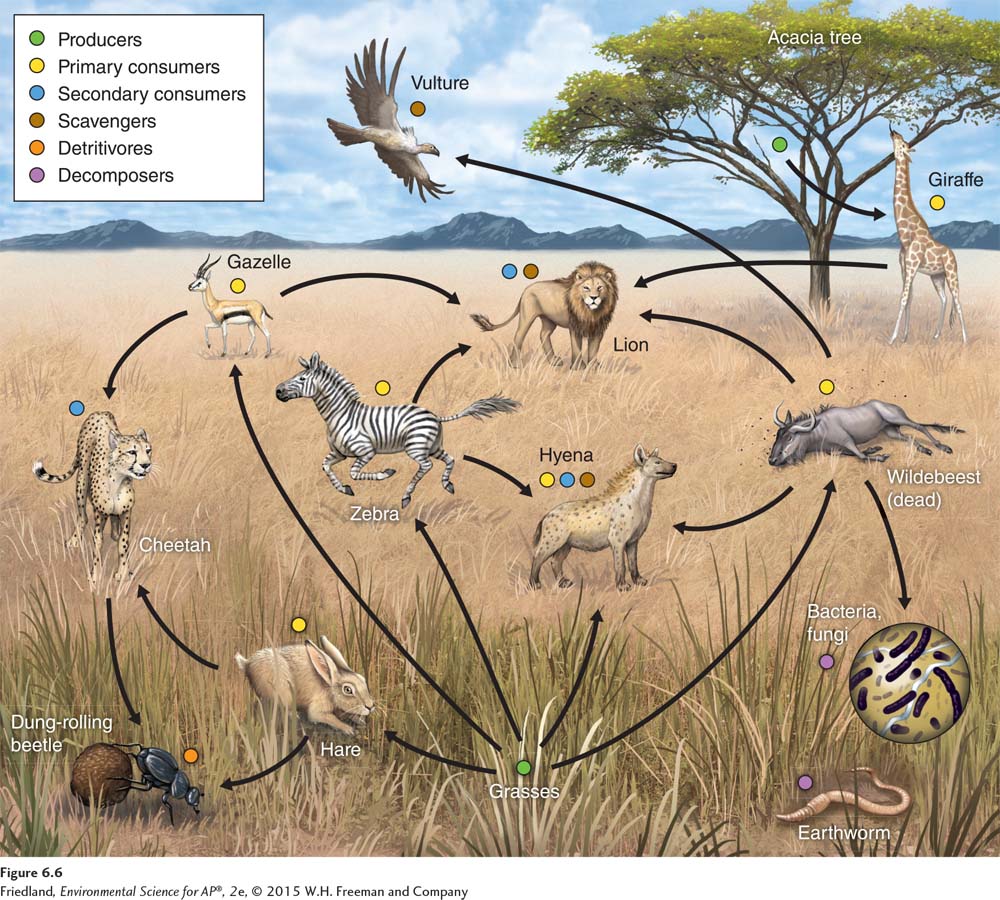
Species in natural ecosystems are rarely connected in such a simple, linear fashion. A more realistic type of model, shown in FIGURE 6.6, is known as a food web. A food web is a complex model of how energy and matter move through trophic levels. Food webs illustrate one of the most important concepts of ecology: All species in an ecosystem are connected to one another.
Not all organisms fit neatly into a single trophic level. Some organisms, called omnivores, operate at several trophic levels. Omnivores include grizzly bears, which eat berries and fish, and the Venus flytrap (Dionaea muscipula), which can photosynthesize as well as digest insects that become trapped in its leaves.
Scavenger An organism that consumes dead animals.
Detritivore An organism that specializes in breaking down dead tissues and waste products into smaller particles.
Decomposers Fungi and bacteria that convert organic matter into small elements and molecules that can be recycled back into the ecosystem.
Each trophic level eventually produces dead individuals and waste products. Three groups of organisms feed on this dead organic matter: scavengers, detritivores, and decomposers. Scavengers are organisms, such as vultures, that consume dead animals. Detritivores are organisms, such as dung beetles, that specialize in breaking down dead tissues and waste products (referred to as detritus) into smaller particles. These particles can then be further processed by decomposers, which are the fungi and bacteria that complete the breakdown process by converting organic matter into small elements and molecules that can be recycled back into the ecosystem. Without scavengers, detritivores, and decomposers, there would be no way of recycling organic matter and energy, and the world would rapidly fill up with dead plants and animals.
74
Some ecosystems are more productive than others
The amount of energy available in an ecosystem determines how much life the ecosystem can support. For example, the amount of sunlight that reaches a lake surface determines how much algae can live in the lake. In turn, the amount of algae determines the number of zooplankton the lake can support, and the size of the zooplankton population determines the number of fish the lake can support.
Gross primary productivity (GPP) The total amount of solar energy that producers in an ecosystem capture via photosynthesis over a given amount of time.
Net primary productivity (NPP) The energy captured by producers in an ecosystem minus the energy producers respire.
To understand where the energy in an ecosystem comes from and how it is transferred through food webs, environmental scientists measure the ecosystem’s productivity. The gross primary productivity (GPP) of the ecosystem is a measure of the total amount of solar energy that the producers in the system capture via photosynthesis over a given amount of time. Note that the term gross, as used here, indicates the total amount of energy captured by producers. In other words, GPP does not subtract the energy lost when the producers respire. The energy captured minus the energy respired by producers is the ecosystem’s net primary productivity (NPP):
75
net primary productivity =
gross primary productivity – respiration by producers
You can think of GPP and NPP in terms of a paycheck: GPP is the total amount your employer pays you while NPP is the actual amount you take home after taxes are deducted.
GPP is essentially a measure of how much photosynthesis is occurring over some amount of time. Determining GPP is a challenge for scientists because a plant rarely photosynthesizes without simultaneously respiring. However, if we can determine the rate of photosynthesis and the rate of respiration, we can use this information to calculate GPP.
We can determine the rate of photosynthesis by measuring the compounds that participate in the reaction. So, for example, we can measure the rate at which CO2 is taken up during photosynthesis and the rate at which CO2 is produced during respiration. A common approach to measuring GPP is to first measure the production of CO2 in the dark. Because no photosynthesis occurs in the dark, this measure eliminates CO2 uptake by photosynthesis. Next, we measure the uptake of CO2 in sunlight. This measure gives us the net movement of CO2 when respiration and photosynthesis are both occurring. By adding the amount of CO2 produced in the dark to the amount of CO2 taken up in the sunlight, we can determine the gross amount of CO2 that is taken up during photosynthesis:
CO2 taken up during photosynthesis =
CO2 taken up in sunlight + CO2 produced in the dark
In this way, we can derive the GPP of an ecosystem per day within a given area. We can give our answer in units of kilograms of carbon taken up per square meter per day (kg C/m2/day).
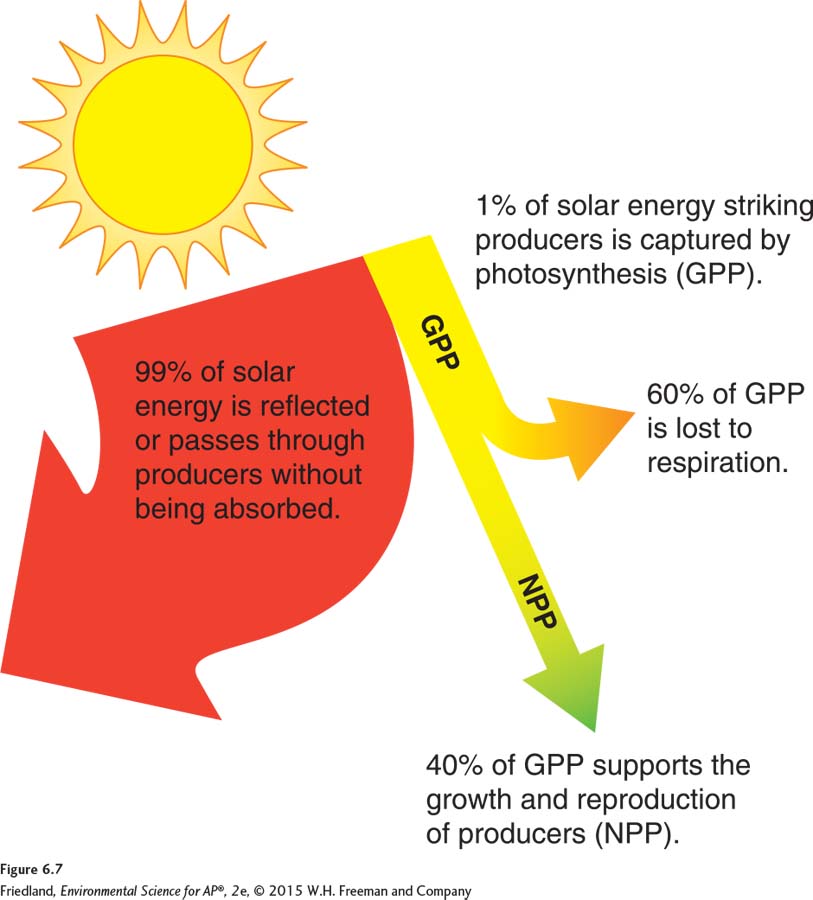
Converting sunlight into chemical energy is not an efficient process. As FIGURE 6.7 shows, only about 1 percent of the total amount of solar energy that reaches the producers in an ecosystem—
The NPP of ecosystems ranges from 25 to 50 percent of GPP, or as little as 0.25 percent of the solar energy striking the plant. Clearly, it takes a lot of energy to conduct photosynthesis. Let’s look at the math. Recall from FIGURE 6.7 that on average, of the 1 percent of the Sun’s energy that is captured by a producer, about 60 percent is used to fuel the producer’s respiration. The remaining 40 percent can be used to support the producer’s growth and reproduction. A forest in North America, for example, might have a GPP of 2.5 kg C/m2/year and lose 1.5 kg C/m2/year to respiration by plants. Because NPP = GPP – respiration, the NPP of the forest is 1 kg C/m2/year (1.8 pounds C/yard2/year). This means that the plants living in 1 m2 of forest will add 1 kg of carbon to their tissues every year by means of growth and reproduction. So, in this example, NPP is 40 percent of GPP.
76
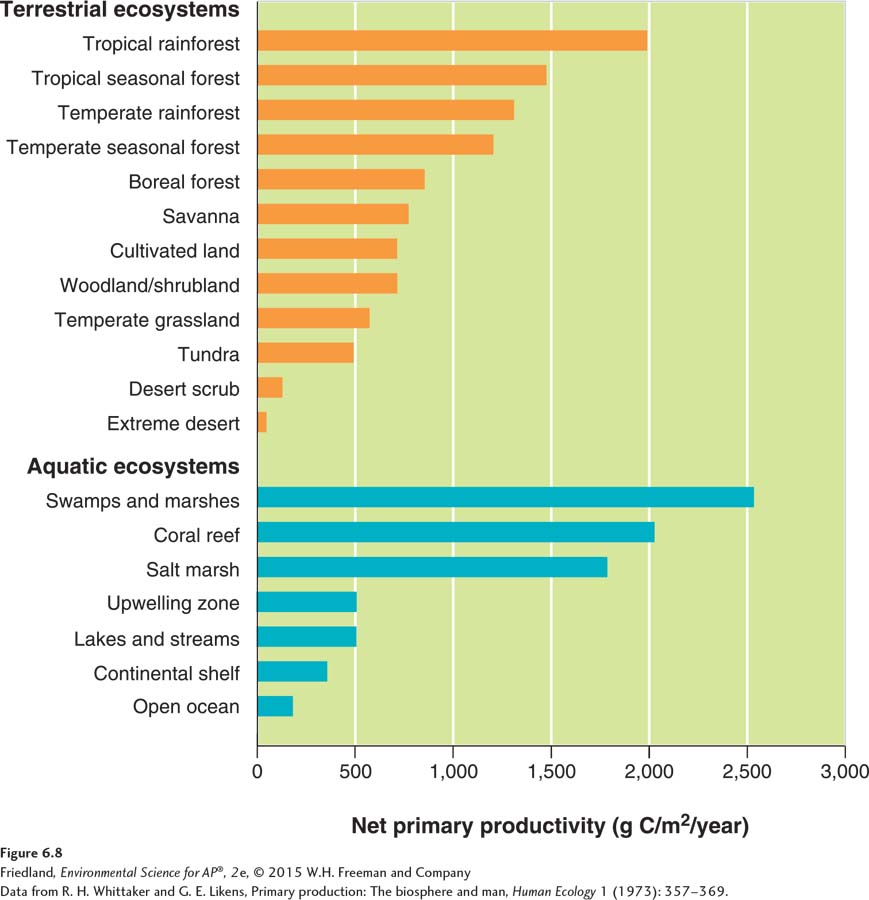
Measurement of NPP allows us to compare the productivity of different ecosystems, as shown in FIGURE 6.8. As you can see, producers grow best in ecosystems where they have plenty of sunlight, lots of available water and nutrients, and warm temperatures, such as tropical rainforests and salt marshes, which are the most productive ecosystems on Earth. Conversely, producers grow poorly in the cold regions of the Arctic, dry deserts, and the dark regions of the deep sea. In general, the greater the productivity of an ecosystem, the more primary consumers can be supported.
Measuring NPP is also a useful way to measure change in an ecosystem. For example, after a drastic change alters an ecosystem, the amount of stored energy (NPP) tells us whether the new system is more or less productive than the previous system.
The efficiency of energy transfer affects the energy present in each trophic level
Biomass The total mass of all living matter in a specific area.
Standing crop The amount of biomass present in an ecosystem at a particular time.
The net primary productivity of an ecosystem establishes the rate at which biomass—the total mass of all living matter in a specific area—
Ecological efficiency The proportion of consumed energy that can be passed from one trophic level to another.
Not all of the energy contained in a particular trophic level is in a usable form. Some parts of plants are not digestible and are excreted by primary consumers. Secondary consumers such as owls consume the muscles and organs of their prey, but they cannot digest bones and hair. Of the food that is digestible, some fraction of the energy it contains is used to power the consumer’s day-
77
Trophic pyramid A representation of the distribution of biomass, numbers, or energy among trophic levels.
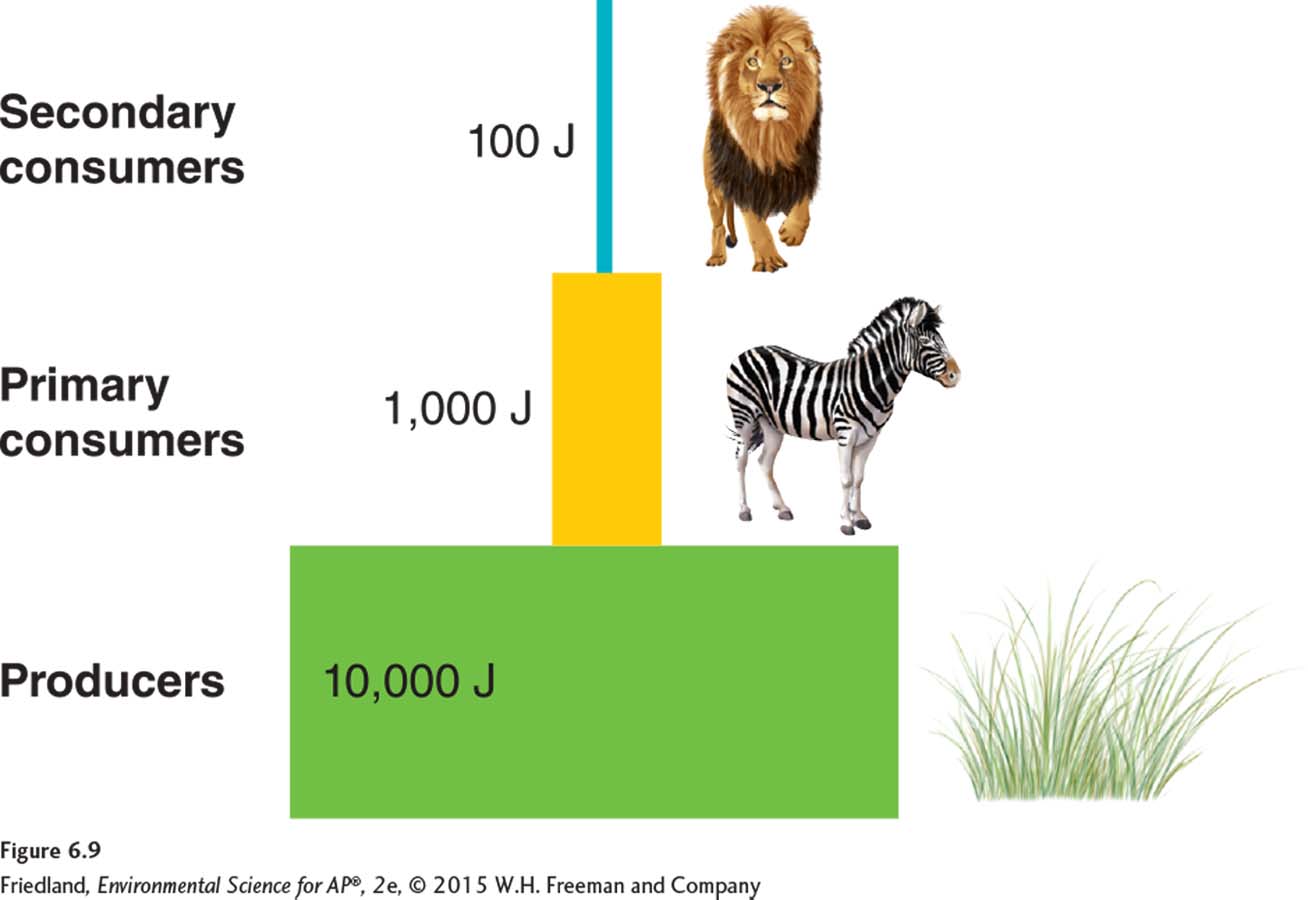
Ecological efficiencies are fairly low; they range from 5 to 20 percent and average about 10 percent across all ecosystems. In other words, of the total biomass available at a given trophic level, only about 10 percent can be converted into energy at the next higher trophic level. We can represent the distribution of biomass among trophic levels using a trophic pyramid, like the one for the Serengeti ecosystem shown in FIGURE 6.9. Trophic pyramids tend to look similar across ecosystems. Most of the energy and biomass are found at the producer level, and they commonly decrease as we move up the pyramid.
The Serengeti ecosystem offers a good example of a trophic pyramid. The biomass of producers (such as grasses and shrubs) is much greater than the biomass of primary consumers (such as gazelles, wildebeests, and zebras) for which the producers serve as food. Likewise, the biomass of primary consumers is much greater than the biomass of secondary consumers (such as lions and cheetahs). The flow of energy between trophic levels helps to determine the population sizes of the various species within each trophic level. As we saw earlier in this chapter, the number of primary consumers in an area is generally higher than that of the carnivores they sustain.
The principle of ecological efficiency also has implications for the human diet. For example, if all humans were to act only as primary consumers—
Suppose a hectare of cropland could produce 1,000 kg of soybeans. This food could feed humans directly. Or, if we assume 10 percent ecological efficiency, it could be fed to cattle to produce approximately 100 kg of meat. In terms of biomass, there would be 10 times more food available for humans acting as primary consumers by eating soybeans than for humans acting as secondary consumers by eating beef. However, 1 kg of soybeans actually contains about 2.5 times as many calories as 1 kg of beef. Therefore, 1 ha of land would produce 25 times more calories when used for soybeans than when used for beef. In general, when we act as secondary consumers, the animals we eat require land to support the producers they consume. When we act as primary consumers, we require only the land necessary to support the producers we eat.
78